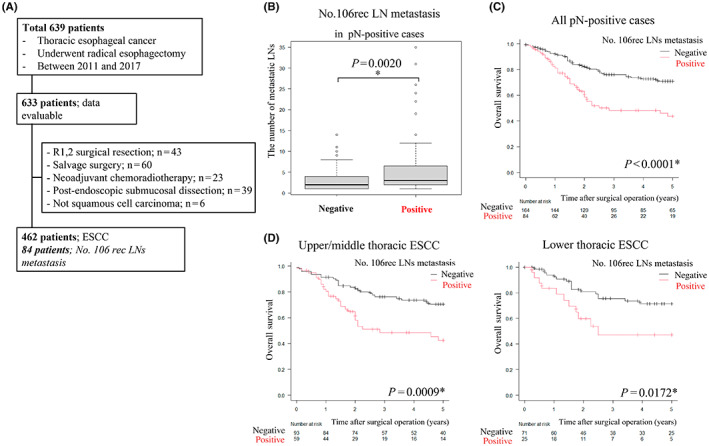
FIGURE 1.

(A) Patient disposition chart. (B) Box plot. Comparison of the number of metastatic lymph nodes (LNs) between No. 106rec positive and negative in pN‐positive cases. *p < 0.05, statistically significant. (C, D) Comparison of overall survival (OS) based on No. 106rec LN metastasis in pN‐positive cases using Kaplan–Meier plots and the log‐rank test. *p < 0.05, statistically significant. (C) All pN‐positive cases. (D) Ut/Mt or Lt cases.
