FIGURE 4.

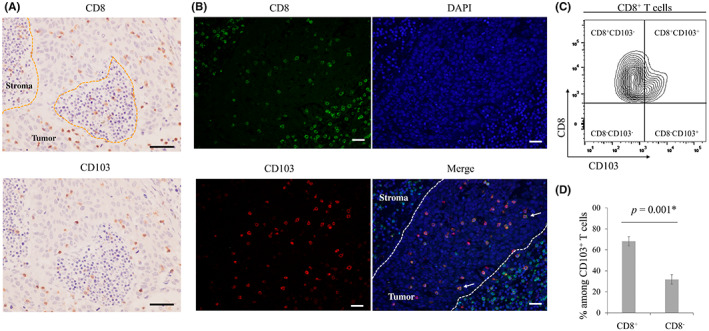
(A) Representative images of immunohistochemical analyses using anti‐CD8 and anti‐CD103 antibodies. Scale bar, 100 μm. (B) Representative images of immunofluorescence staining of CD8 (green), CD103 (red), and DAPI (blue) are shown. In tumoral lesions, most CD103+ cells also expressed CD8 (arrows). Scale bar, 100 μm. (C), (D) Flow cytometry analysis. (c) Representative contour plots of CD8+ T cells. (d) Bar graph shows the mean ± SE of the proportion of CD8+ and CD8− T cells among CD103+ T cells in metastatic lymph nodes (LNs) from eight esophageal cancer cases. CD8+CD103+ T cells accounted for 68.2% of CD103+ T cells. *p < 0.05, statistically significant.
