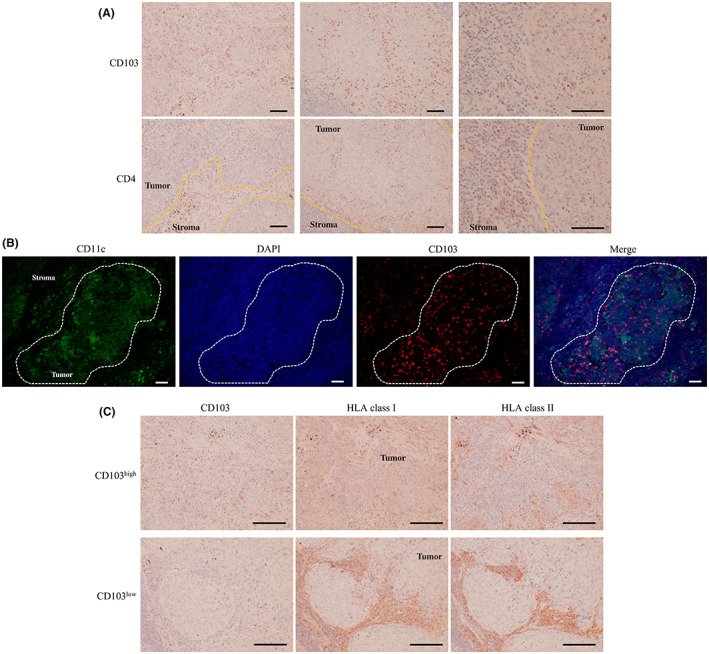
FIGURE 5.

(A) Representative images of immunohistochemical analyses using anti‐CD4 and anti‐CD103 antibodies. Scale bar, 100 μm. (B) Representative images of immunofluorescence staining of CD11c (green), CD103 (red), and DAPI (blue). Scale bar, 100 μm. (C) Representative images of immunohistochemical analyses using anti‐HLA class I/II and anti‐CD103 antibodies. Scale bar, 100 μm.
