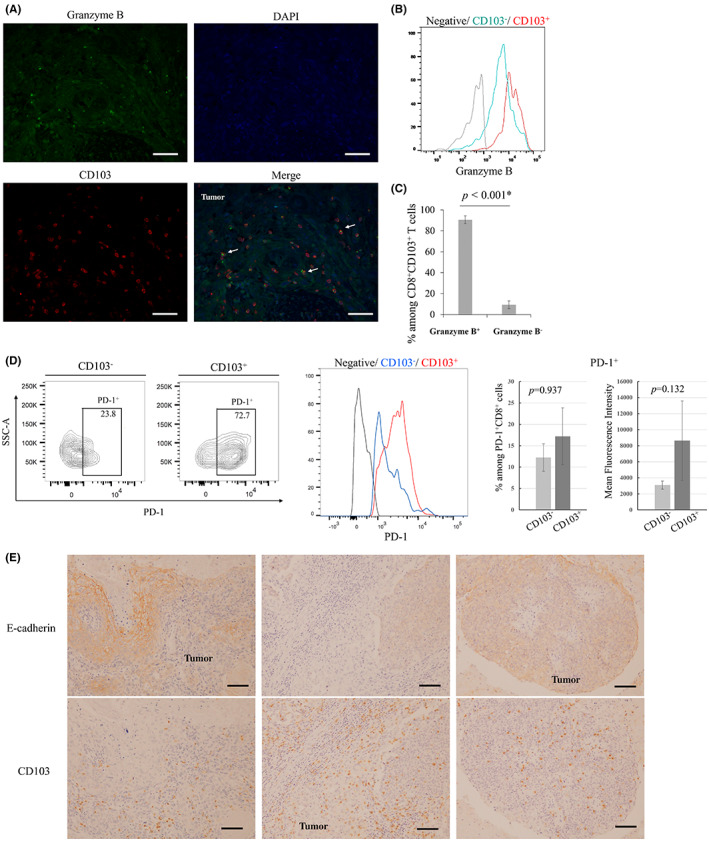
FIGURE 6.

(A) Representative images of immunofluorescence double staining of CD103 (red), granzyme B (green), and DAPI (blue). CD103 cells that infiltrated tumoral lesions contained the intracellular cytokine granzyme B (arrows). Scale bar, 100 μm. (B), (C) Flow cytometry analysis of granzyme B in CD103+CD8+ T cells and CD103−CD8+ T cells. (B) Representative histogram. (C) Bar graph shows the mean ± SE of the proportion of granzyme B+ and granzyme B− cells among CD8+CD103+ T cells. Granzyme B+CD8+CD103+ T cells accounted for 90.7% of CD8+CD103+ T cells. (D) Flow cytometry analysis of PD‐1 expression among CD103+ cells and CD103− cells. Representative contour plots and histogram. Bar graphs show the mean ± SE of the proportion or the mean fluorescence intensity of PD‐1 expression based on CD103 expression. (E) Representative images of immunohistochemical analyses using anti‐CD103 and anti‐E‐cadherin antibodies. Scale bar, 100 μm.
