FIGURE 2.

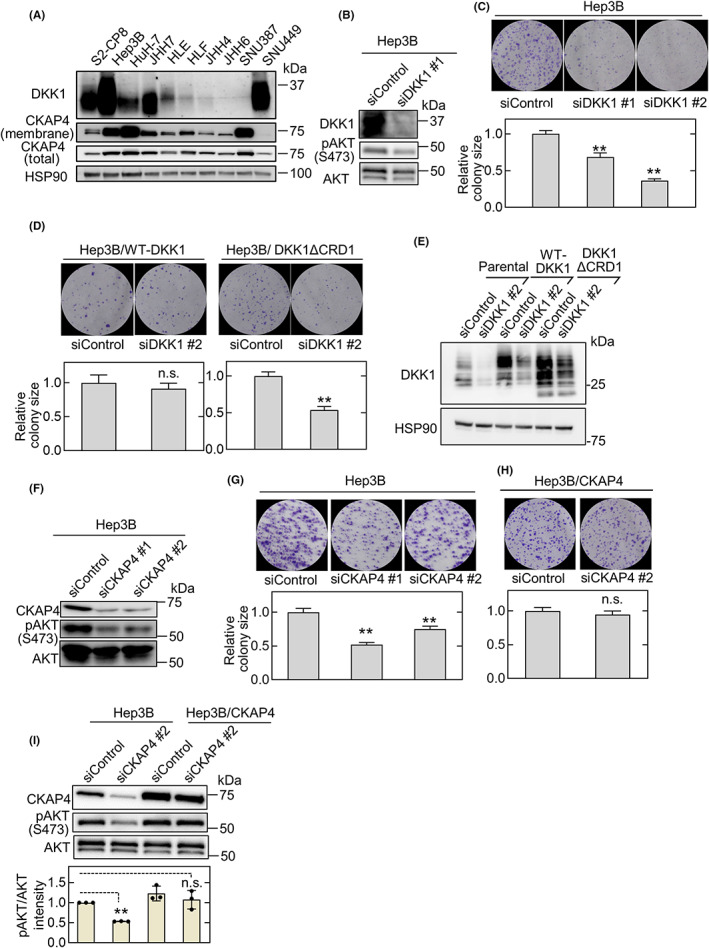
Dickkopf‐1 (DKK1) and cytoskeleton‐associated protein 4 (CKAP4) are required for hepatocellular carcinoma (HCC) cell proliferation. (A) Various HCC and S2‐CP8 pancreatic cancer cells were biotinylated, and cell surface proteins were precipitated using NeutrAvidin Agarose beads. Precipitates (membranes) were probed with an anti‐CKAP4 Ab, and the cell lysates were probed with the indicated Abs. Heat shock protein 90 (HSP90) was used as a loading control. (B) Lysates from Hep3B cells transfected with control siRNA (siControl) or DKK1 siRNA #1 (siDKK1 #1) were probed with the indicated Abs. (C) Hep3B cells transfected with control or two independent DKK1 siRNAs were cultured for 14 days. The areas of the colonies were measured. Microscopic images of representative colonies (top panels) and colony areas (bottom panels) are shown. The areas of at least 50 colonies were measured for each condition, and the results are expressed relative to the control condition. Data are presented as the mean ± SE. **p < 0.01 (ANOVA post‐hoc test). (D) Hep3B cells stably expressing WT DKK1 or DKK1ΔCRD1 (cysteine‐rich domain 1) were transfected with control or DKK1 siRNA #2 and cultured for 14 days. **p < 0.01 (Student's t‐test). n.s., not significant. (E) Lysates from Hep3B cells and Hep3B cells stably expressing WT DKK1 or DKK1ΔCRD1 and transfected with control or DKK1 siRNA #2 were probed with the indicated Abs. (F) Lysates from Hep3B cells transfected with control or two independent CKAP4 siRNAs (siCKAP4) were probed with the indicated Abs. (G) Hep3B cells transfected with control or two independent CKAP4 siRNAs were cultured for 14 days. The areas of the colonies were measured. **p < 0.01 (ANOVA post‐hoc test). (H) Hep3B cells stably expressing CKAP4 and transfected with control or CKAP4 siRNA #2 were cultured for 14 days. n.s., not significant (Student's t‐test). (I) Lysates from Hep3B cells and Hep3B cells stably expressing CKAP4 transfected with control or CKAP4 siRNA #2 were probed with the indicated Abs (top panels). Relative band intensities for pAKT/AKT are shown in arbitrary units (bottom panel). Scale bars, 1 mm. Data are presented as the mean ± SD. **p < 0.01 (ANOVA post‐hoc test). n.s., not significant
