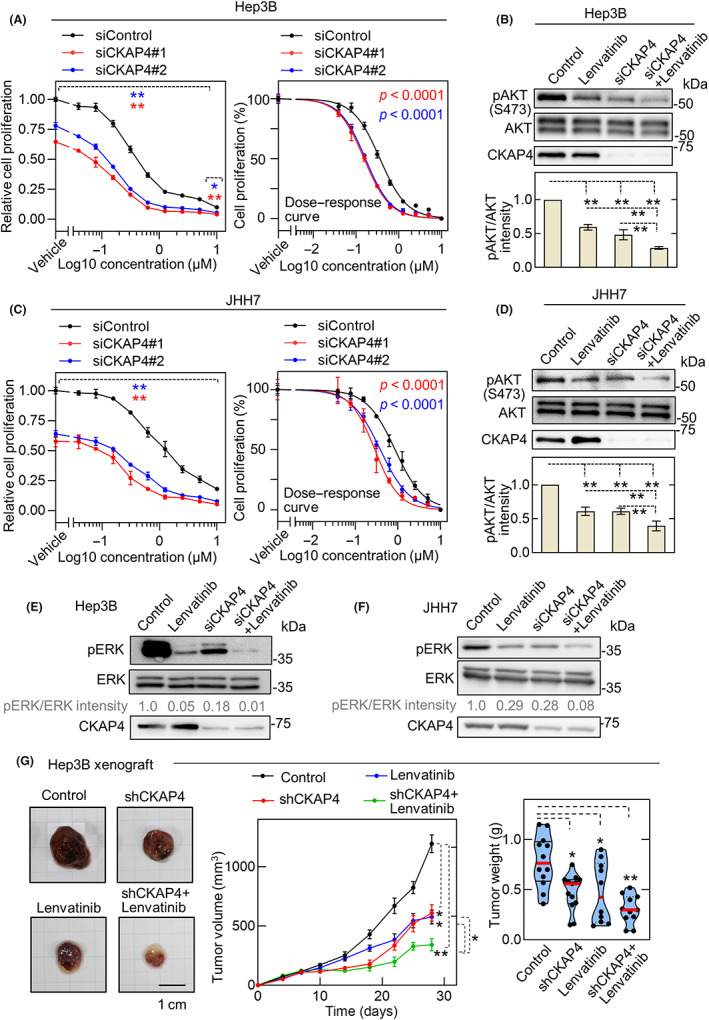
FIGURE 4.

Cytoskeleton‐associated protein 4 (CKAP4) depletion in hepatocellular carcinoma cells enhances the antitumor activity of lenvatinib. (A, C) Hep3B (A) and JHH7 (C) cells were transfected with control or two independent CKAP4 siRNAs and then subjected to a 2D cell proliferation assay in the presence of the indicated concentration of lenvatinib (left panels). Results are expressed as arbitrary units (siControl cells without lenvatinib treatment = 1). Data are presented as the mean ± SD. Normalized dose–response curves of cell proliferation analyzed by nonlinear regression model are shown. Each curve was statistically compared using logIC50 as a parameter (right panels). *p < 0.05; **p < 0.01 (ANOVA post hoc test). (B, D) Hep3B (B) and JHH7 (D) cells transfected with control or CKAP4 siRNA were treated with vehicle or 1 μM lenvatinib for 12 h. Cell lysates were probed with the indicated antibodies (top panels). Relative band intensities for pAKT/AKT are shown in arbitrary units (bottom panel). **p < 0.01 (ANOVA post‐hoc test). (E, F) Hep3B (E) and JHH7 (F) cells transfected with control or CKAP4 siRNA were treated with vehicle or 1 μM lenvatinib for 12 h. Cell lysates were probed with the indicated Abs (top panels). Relative band intensities for pERK/ERK are shown in arbitrary units. (G) Mice were subcutaneously inoculated with Hep3B cells stably expressing control or CKAP4 shRNA and treated daily with vehicle (control: n = 12, shCKAP4: n = 13) or 1 mg/kg of lenvatinib orally (control, n = 10; shCKAP4, n = 11). Tumor development was observed for 28 days. Tumor volumes are shown as the mean ± SE. Tumor weights are plotted as violin plots. Scale bar, 10 mm. *p < 0.05; **p < 0.01 (ANOVA post‐hoc test)
