
FIGURE 6.
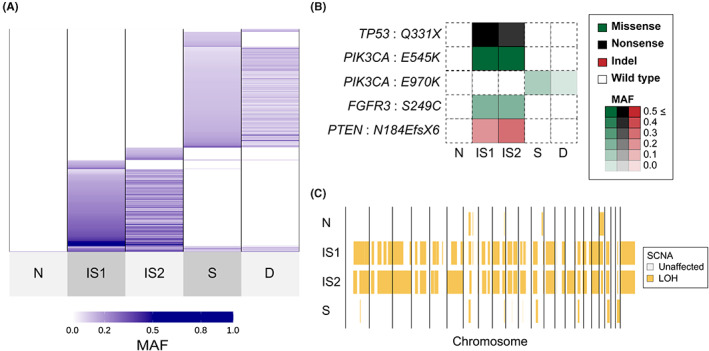
Sharing pattern of genomic alterations in case 2. A, Sharing pattern of somatic single‐nucleotide variants (SNVs) and short insertions/deletions (Indels) among five tissues. Color density indicates the mutant allele frequency (MAF) of each somatic mutation. B, Heatmaps demonstrate the representative oncogenic alterations in case 2. Color and density indicate the type and MAF of each somatic mutation, respectively. C, Genome‐wide profiles of loss of heterozygosity (LOH) in the four samples. Vertical lines correspond to chromosome numbers. The disseminated tumor in the small intestinal mesentery (D) was excluded from the copy number analysis because of the low purity (Table S2)