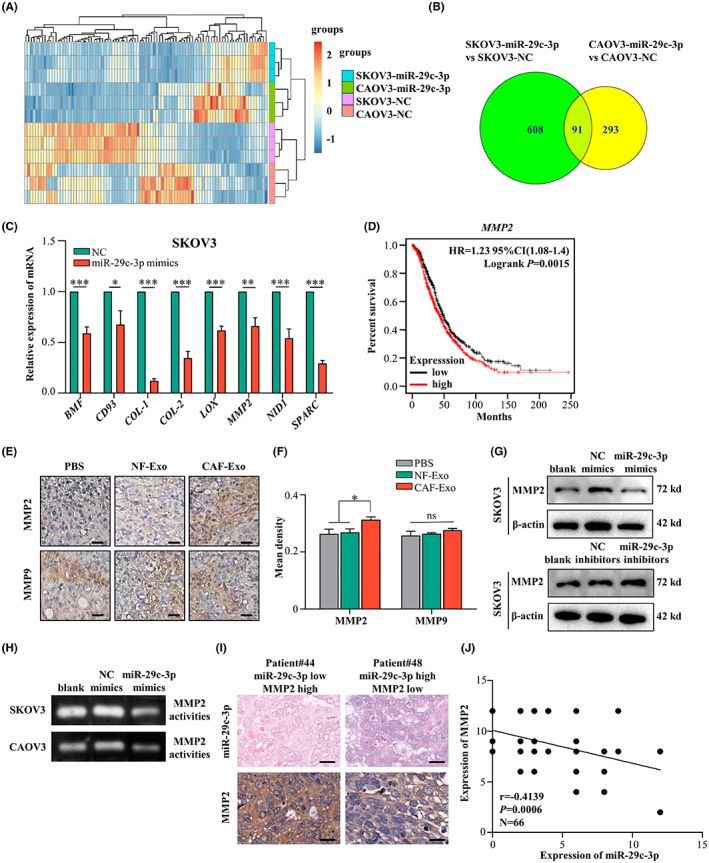
FIGURE 5.

MMP2 is identified as a target gene of microRNA (miR)‐29c‐3p in ovarian cancer cells. (A) Heatmap diagram of differential mRNA expression profiles between CAOV3‐negative control (NC) and CAOV3‐miR‐29c‐3p, and SKOV3‐NC, and SKOV3‐miR‐29c‐3p. (B) Venn diagram illustrating the putative candidate 91 target genes of miR‐29c‐3p in SKOV3 and CAOV3 cells. (C) Histograms showing the relative expression of eight potential target genes of miR‐29c‐3p in SKOV3‐NC and SKOV3‐miR‐29c‐3p cells detected by quantitative RT‐PCR. (D) Kaplan–Meier analysis of MMP2 in ovarian cancer in pancancer analysis with K–M Plotter. (E) Representative images of immunohistochemical staining with anti‐MMP2 and anti‐MMP9 in tumor tissues from orthotopic xenotransplants. Scale bar, 50 μm. (F) Histograms showing the mean density of MMP2 and MMP9 in the three groups of orthotopic xenograft mouse model. (G) Western blot analysis of MMP2 in SKOV3‐NC, SKOV3‐miR‐29c‐3p, and SKOV3‐miR‐29c‐3p inhibitor. (H) Conditioned media from SKOV3‐NC, SKOV3‐miR‐29c‐3p, or CAOV3‐NC, CAOV3‐miR‐29c‐3p were subjected to gelatin zymography, to assess gelatinolytic activities of MMP‐2. (I) Representative images of in situ hybridization (ISH) of miR‐29c‐3p and immunohistochemical staining of MMP2. (J) Scatter diagrams show the negative correlation between miR‐29c‐3p and MMP2 in ovarian cancer based on miR‐29c‐3p ISH and MMP2 stains scores. Scale bar, 20 μm. *p < 0.05; **p < 0.01; ***p < 0.01. ns, no significance
