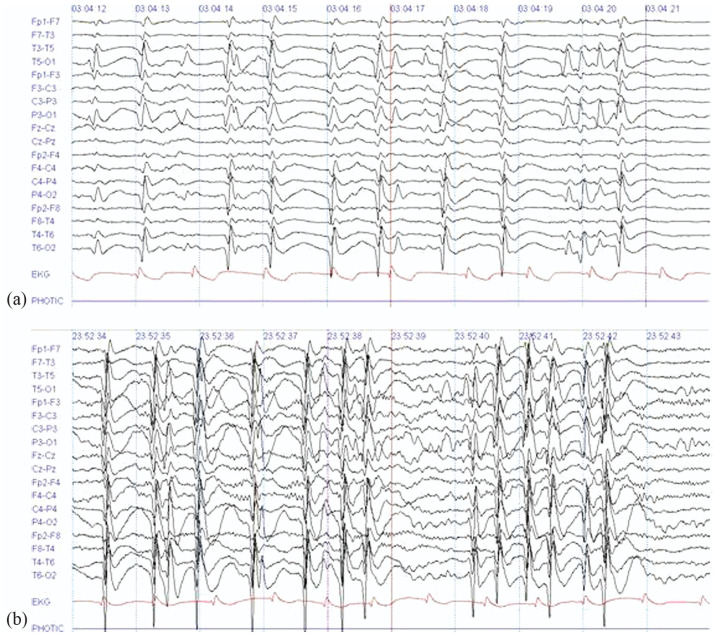
Figure 1.
(a) Sleep record, (b) awake record: (sensitivity 15 and 7 Mv/mm; speed 30 mm/s; high cut 70 Hz; low cut 1 Hz), Spike-wave complexes at 1.5–3 Hz are shown with a predominance in bilateral occipital regions during both sleep and wakefulness. These are evidenced on multiple occasions along the 12-h video EEG monitoring. Source: original by the authors.

