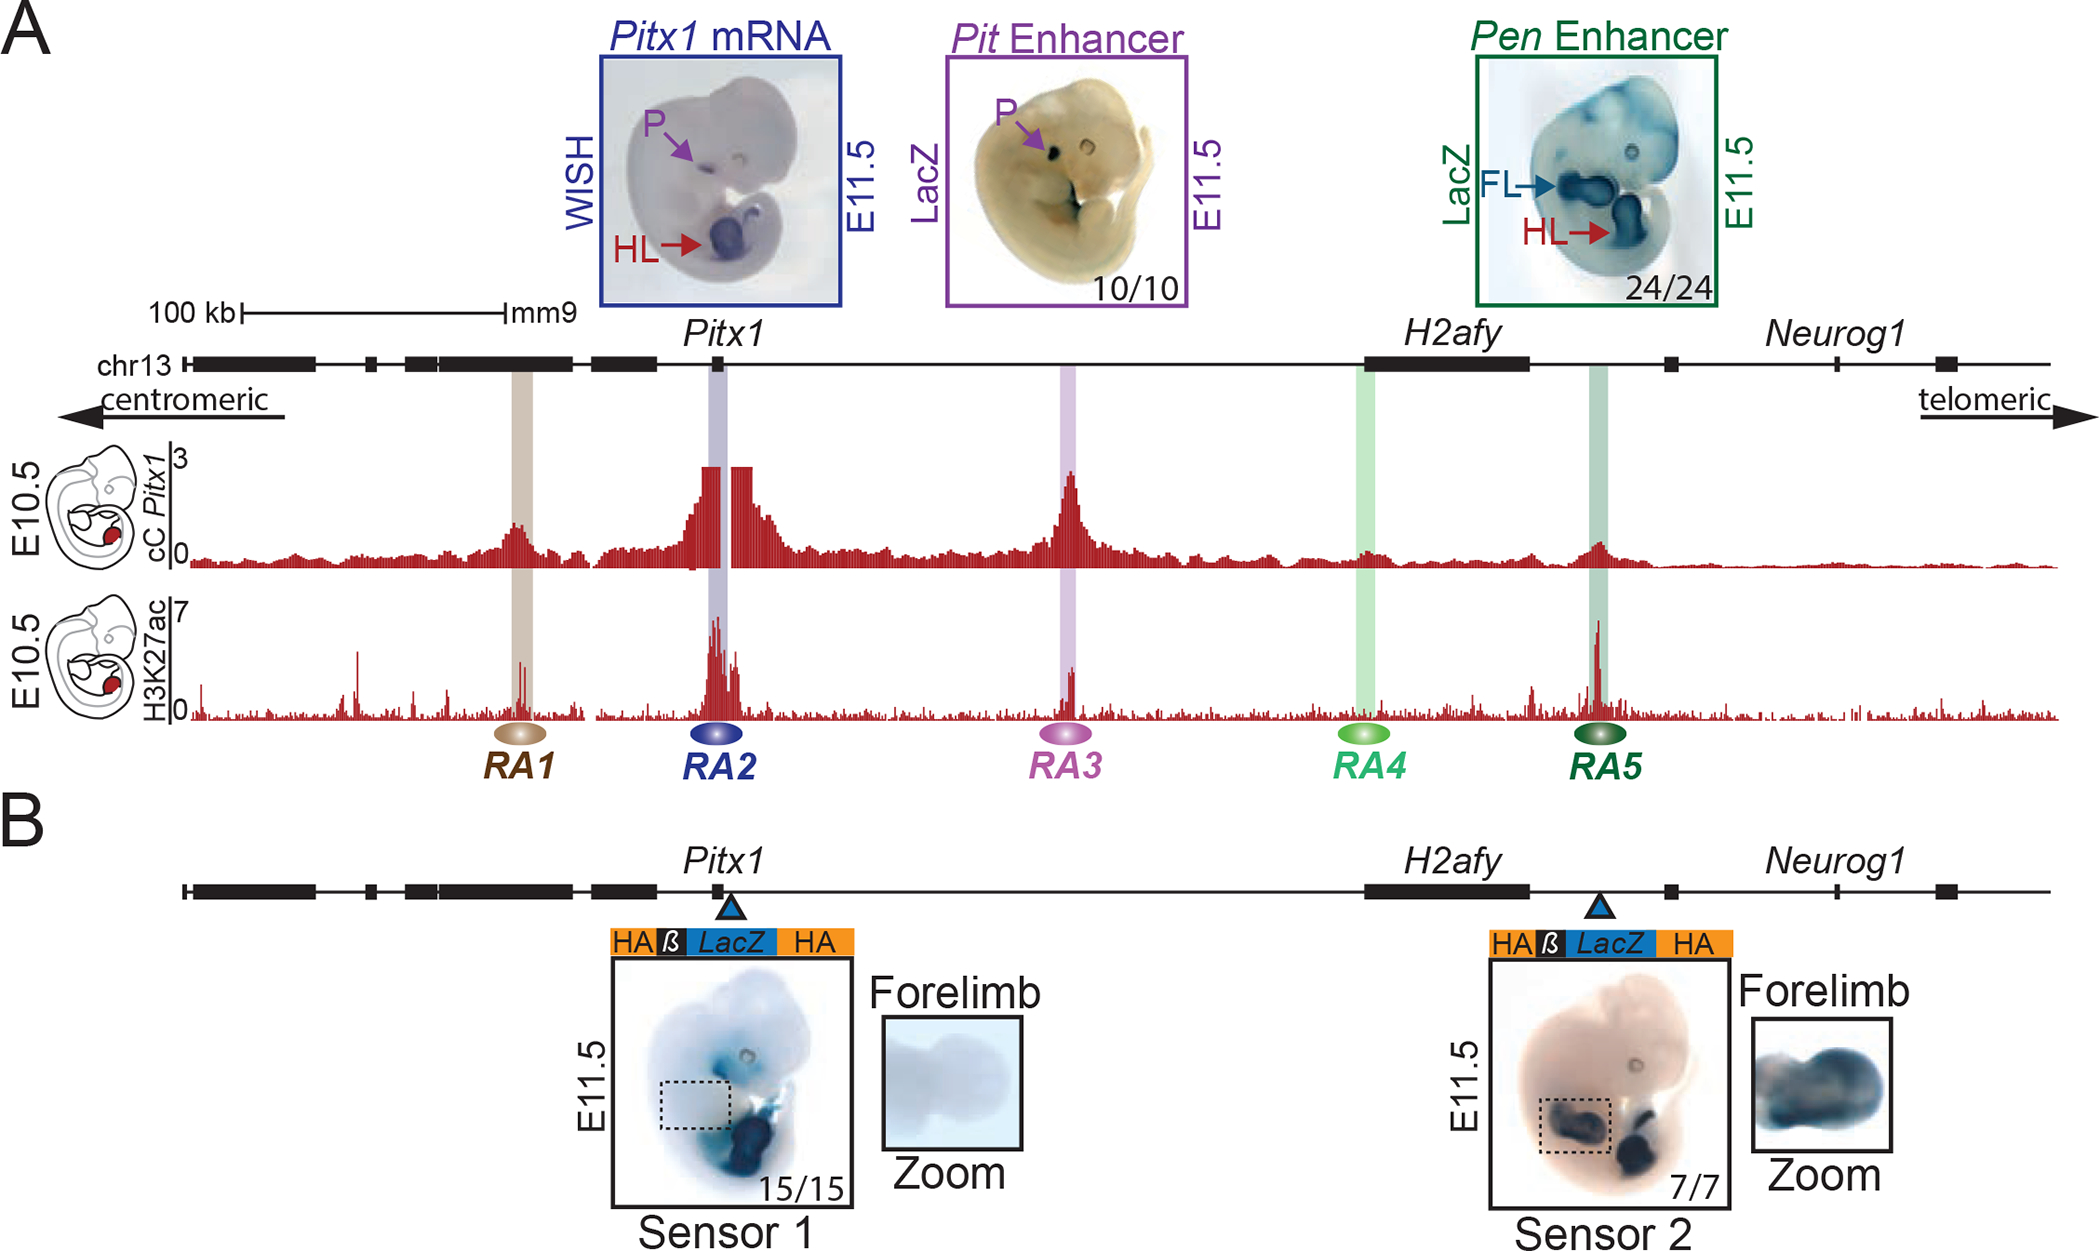
Figure 1. Pitx1 regulatory landscape includes a pan-limb region.

A. Pitx1 regulatory landscape in hindlimbs. Top left: WISH of Pitx1 at E11.5, showing hindlimb (HL) and pituitary (P) specific expression. Top middle and right: LacZ reporter activity at E11.5 of RA3 (Pit enhancer) showing activity in pituitary in 10 out of 10 embryos and of RA5 (Pen enhancer) showing activity in fore- and hindlimbs in 24 out of 24 embryos (see FL and HL). Upper red track: Capture-C (cC) in E10.5 hindlimbs using Pitx1 promoter as viewpoint demonstrating chromatin interactions with regulatory anchors (RA1 to RA5). Lower red track: H3K27ac ChIP-seq enrichment profile in E10.5 hindlimbs. B. LacZ sensors 1 and 2 reflect endogenous regulatory activity at E11.5. Blue arrowheads indicate the positions of the integrations. Sensor-1 recapitulates Pitx1 expression pattern in 15 out of 15 embryos (compare with Pitx1 WISH in A). Note the absence of forelimb staining. Sensor-2 shows a strong fore- and hindlimb activity in 7 out of 7 embryos, similar to the Pen enhancer (compare with Pen LacZ activity in A).
