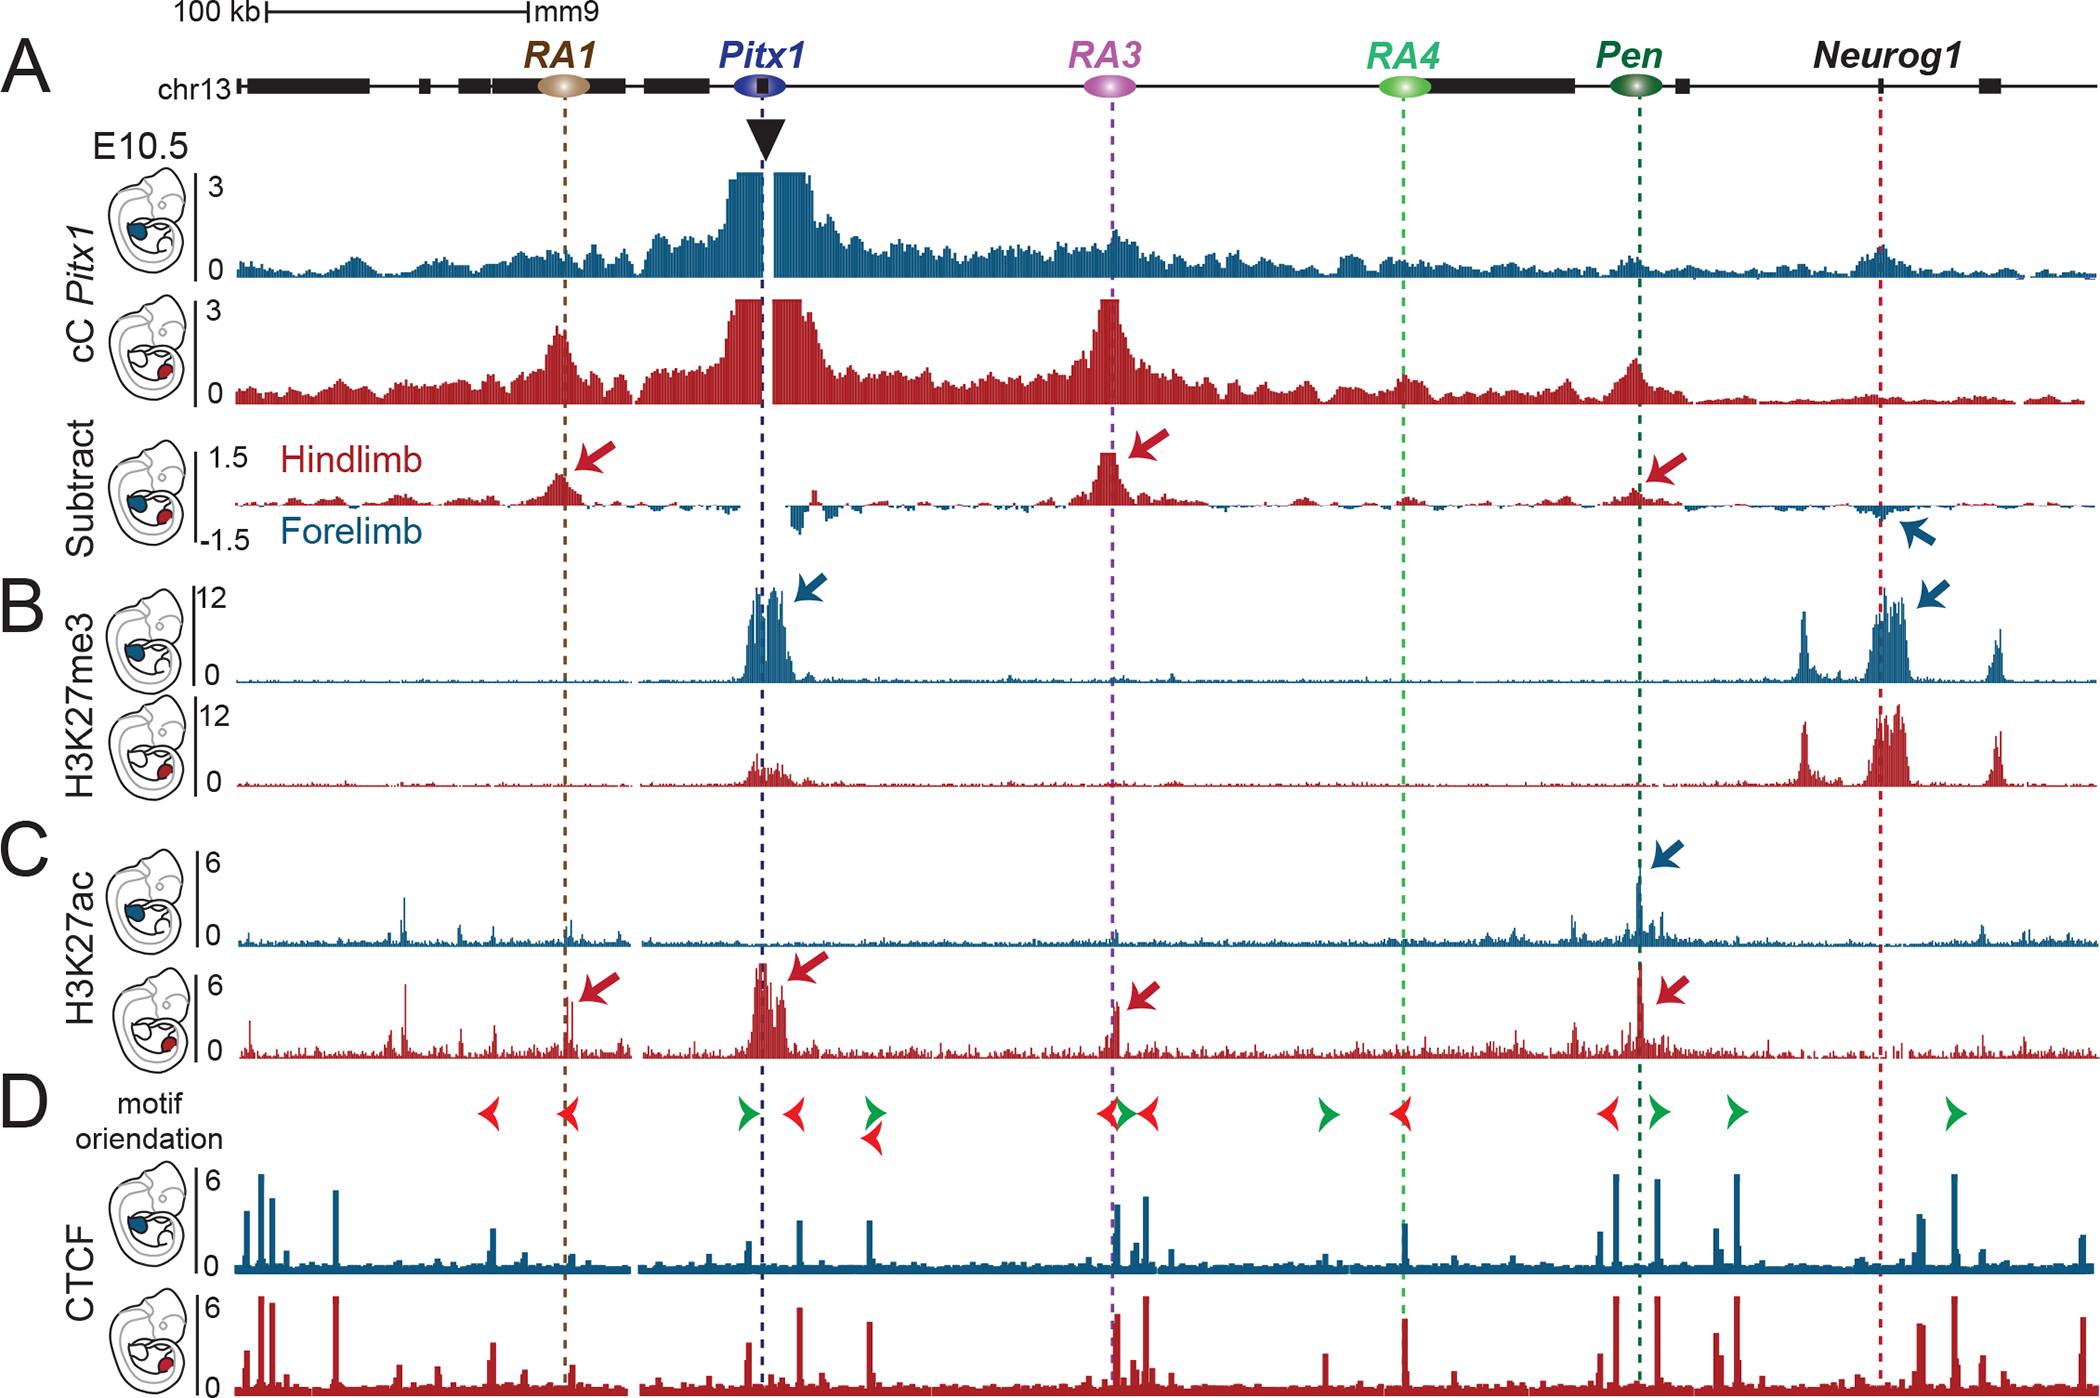
Figure 3. Chromatin architecture in fore- and hindlimb demonstrates tissue-specific interaction with active and repressed regions.

A. Capture-C of Pitx1 promoter in E10.5 forelimb (blue) or hindlimb (red) tissues. The subtraction of the two tracks shows the differences in chromatin interactions, whereby hindlimb-specific interactions are indicated by red arrows, and a forelimb-specific interaction with a blue arrow. B. ChIP-seq tracks of H3K27me3 in E10.5 forelimb (blue) or hindlimb (red) tissues show the forelimb specific repressive interaction between Pitx1 and Neurog1 region. C. ChIP-seq tracks of H3K27ac in E10.5 forelimb (blue) or hindlimb (red) tissues show the deposition of hindlimb specific acetylation at RA1, Pitx1 and RA3, while the Pen region shows acetylation in both fore-and hindlimb tissues. D. ChIP-seq tracks of CTCF in E10.5 forelimb (blue) or hindlimb (red) tissues show little changes in binding. Orientation of CTCF motif is indicated with green and red arrowheads on top.
