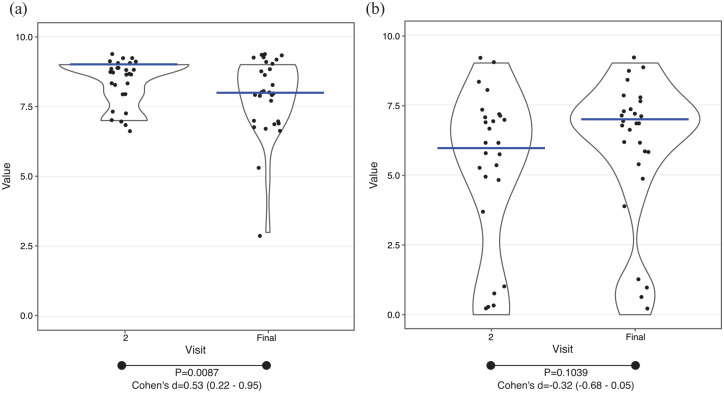
Figure 6.
Adherence and difficulty of the diet. Black dots, individual results; blue lines, median value. (a) Adherence to the diet. (b) Difficulty to comply the diet.
95% of confidence interval, <0.2, negligible effect; 0.2–0.5, small effect; 0.5–0.8, moderate effect; >0.8, large effect.
Cohen’s d, effect size of paired t-test; p, p value of paired t-test.

