. 2023 Mar 7;11(5):629–645. doi: 10.1158/2326-6066.CIR-22-0655

Figure 6.

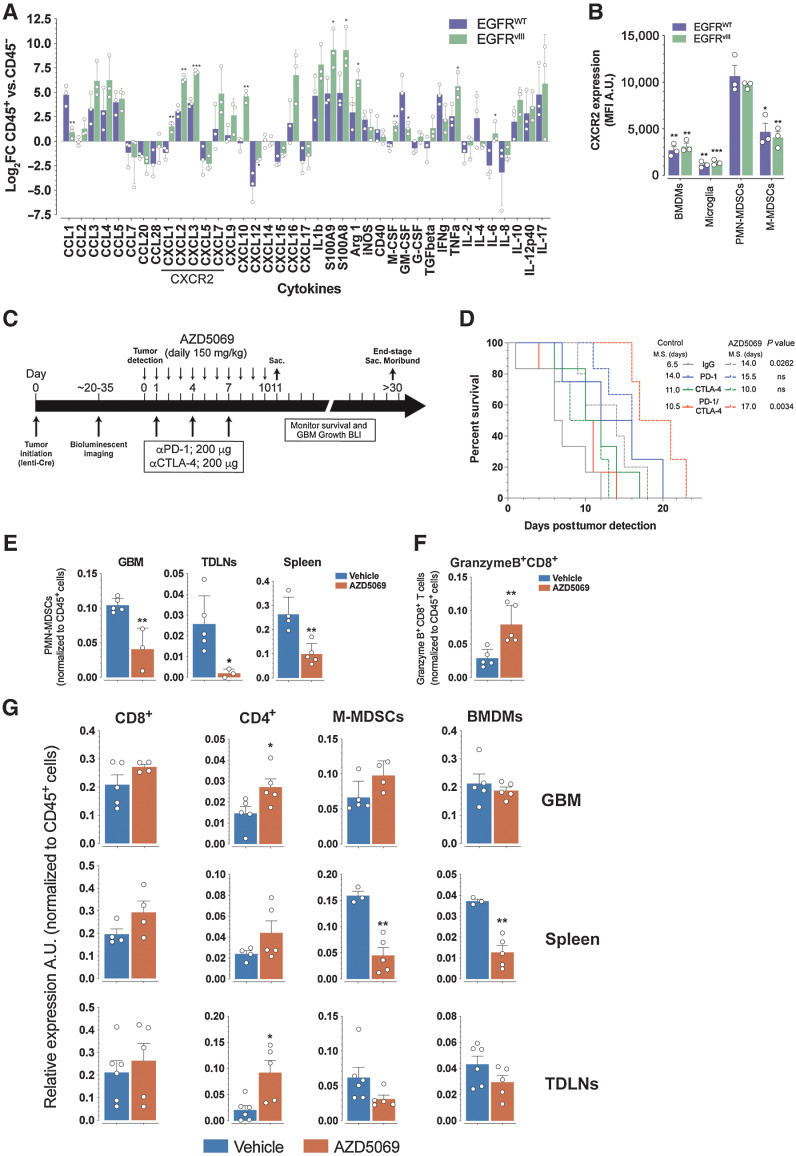
Figure 6. EGFR WT and EGFRvIII GBMs have distinct cytokine profiles. A, Log2 fold change (FC) of CD45+/CD45− ratio from qRT PCR of the indicated cytokines from flow-sorted CD45+ and CD45– GBMs. B, Expression (mean fluorescent intensity MFI) of CXCR2 on the indicated cell types from GBMs. Comparisons of BMDMs, microglia, and M-MDSCs are to PMN-MDSCs. C, AZD5069 treatment schema of EGFRvIII mice. D, Kaplan–Meier analysis of EGFRvIII GBM mice treated with indicated treatments with or without AZD5069. M.S., median survival. P values log-rank (Mantel–Cox) test. E, Quantification of PMN-MDSCs in GBM, spleen, and TDLNs. F, Quantification of GranzymeB+CD8+ T cells in GBMs of control and AZD5069-treated mice. G, Quantification of the indicated cell types in GBM, spleen, and TDLNs from control and AZD5069 treated mice. Data are mean ± SEM of biological replicates (*, P < 0.05; **, P < 0.01; ***, P < 0.001; ****, P < 0.0001; unpaired t test, two-tailed).

EGFR WT and EGFRvIII GBMs have distinct cytokine profiles. A, Log2 fold change (FC) of CD45+/CD45 ratio from qRT PCR of the indicated cytokines from flow-sorted CD45+ and CD45 GBMs. B, Expression (mean fluorescent intensity MFI) of CXCR2 on the indicated cell types from GBMs. Comparisons of BMDMs, microglia, and M-MDSCs are to PMN-MDSCs. C, AZD5069 treatment schema of EGFRvIII mice. D, Kaplan–Meier analysis of EGFRvIII GBM mice treated with indicated treatments with or without AZD5069. M.S., median survival. P values log-rank (Mantel–Cox) test. E, Quantification of PMN-MDSCs in GBM, spleen, and TDLNs. F, Quantification of GranzymeB+CD8+ T cells in GBMs of control and AZD5069-treated mice. G, Quantification of the indicated cell types in GBM, spleen, and TDLNs from control and AZD5069 treated mice. Data are mean ± SEM of biological replicates. *, P < 0.05; **, P < 0.01; ***, P < 0.001; ****, P < 0.0001; unpaired t test, two-tailed.