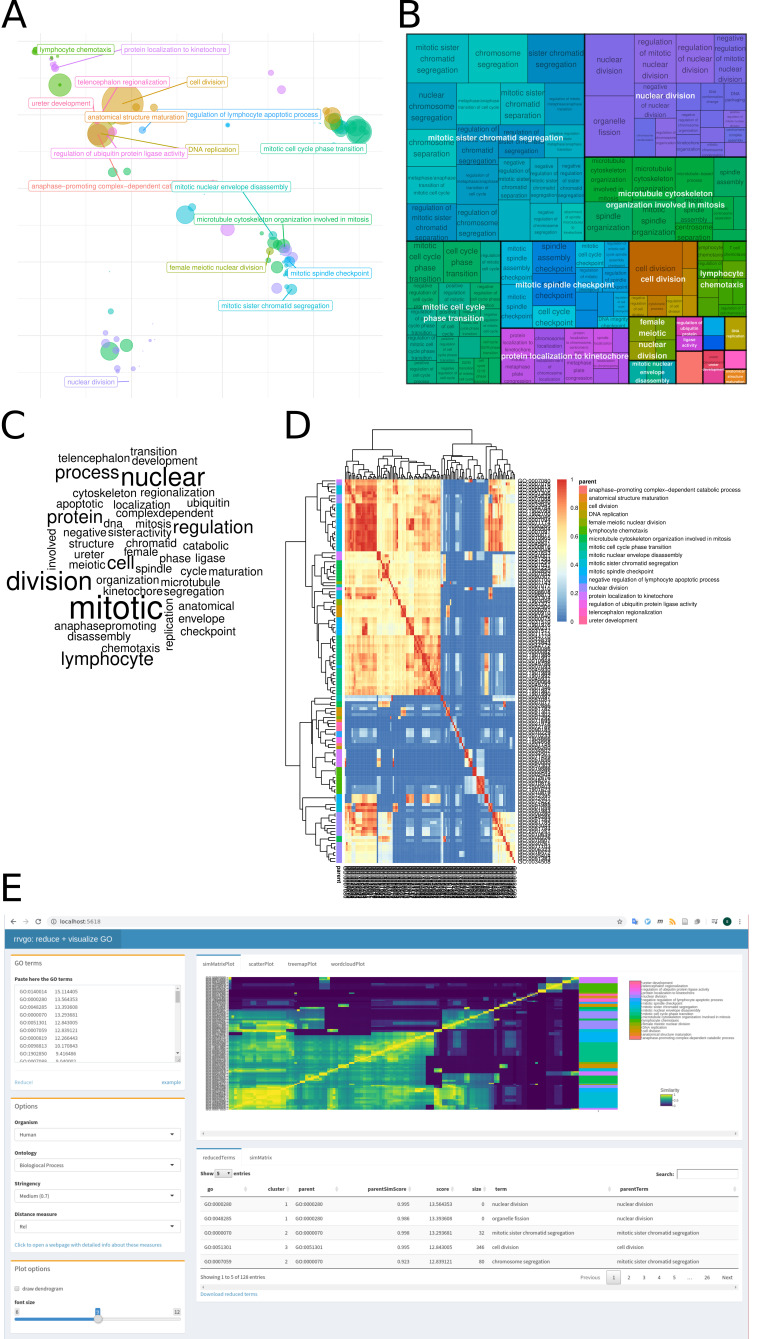
Figure 1. Different visualizations of the reduced terms provided by rrvgo.
(A) scatter plot represented by the first 2 components of a PCoA of the dissimilarity matrix. (B) space-filling visualization (treemap) of terms grouped by the representative term. (C) word cloud emphasizing frequent words in GO terms. (D) heatmap representation of the similarity matrix. (E) Companion Shiny App for interactive visualization of similarity between GO terms.

