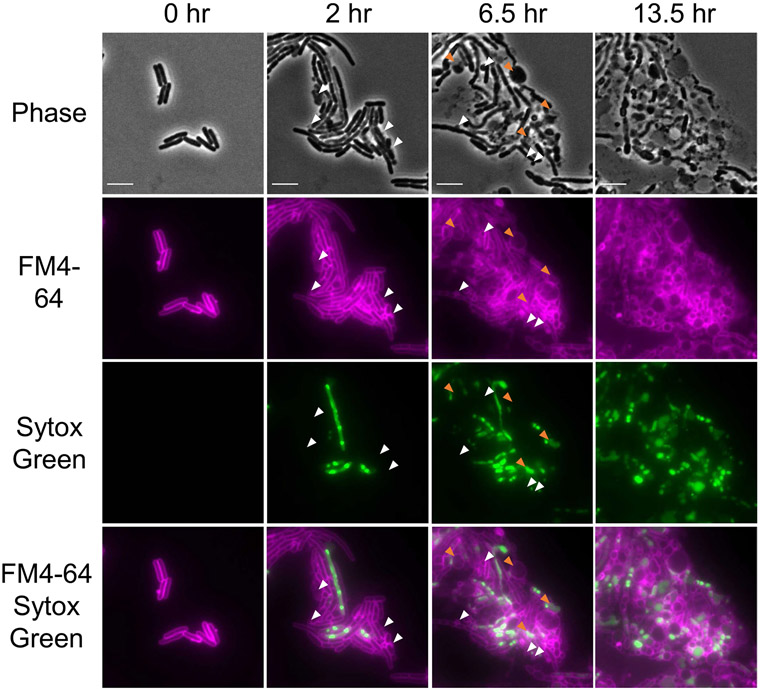
Extended Data Fig. 9 ∣. Time-lapse microscopy of E. coli undergoing dynobactin A treatment.
E. coli MG1655 cells were spotted onto a 1.5% agarose pad containing dynobactin A (8x MIC), the membrane stain FM4-64 10 μg mL−1 (false-colored in magenta), and membrane permeabilization stain Sytox Green 0.5 μM (false-colored in green). Cells were incubated at 37 °C in a thermostatic chamber and imaged every 15 minutes under the microscope. The panels and selected time points were chosen to best represent the population of E. coli MG1655 undergoing dynobactin A treatment. White arrows indicate representative examples of membrane blebbing; orange arrows indicate examples of swelling or cell lysis. Scale bars, 5 μm. This experiment is representative of two biologically-independent experiments performed, each showing similar results.

