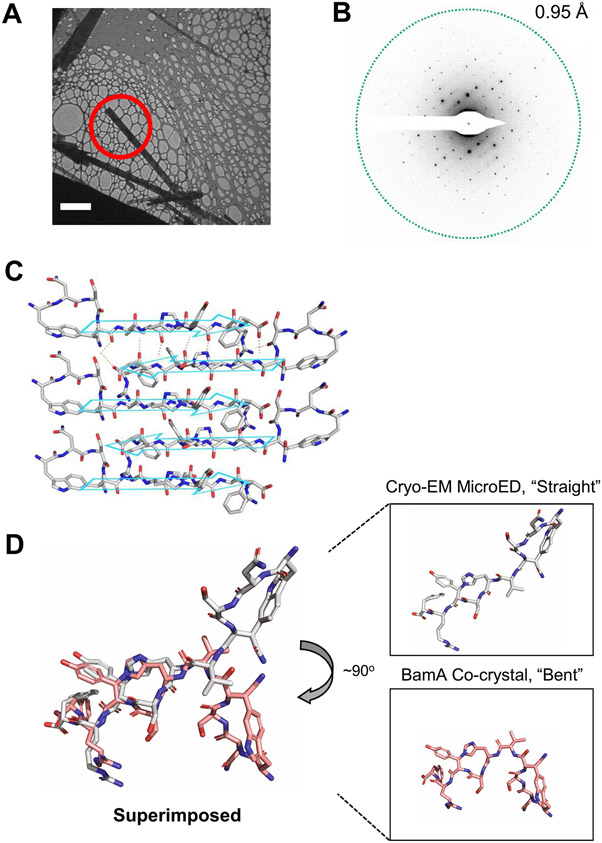
Extended Data Fig. 3 ∣. CryoEM microED structure determination.
MicroED data collection and analysis of 19 independent crystals of dynobactin A yielded structure, further details are elaborated within Methods. (A) Bright-field TEM image of dynobactin crystals (Scale bar: 5 μm). (B) Electron diffraction pattern with resolution ring at 0.95 Å. (C) 2D crystal packing arrangements of dynobactin. The intramolecular hydrogen bonds are shown as dashed lines for the top two molecules. The crystallographic b axis is parallel to the vertical direction of the figure. (D) Dynobactin A shows flexible conformations. Left shows superimposition dynobactin A microED structure (straight) and the dynobactin A structure observed in co-crystal with target BamA (bent). Right panels depict individual structures side-by-side. Separation of the two macrocycle rings in dynobactin A allows for free rotation about 4 bonds, creating an approximate 90° kink in the dynobactin A structure.

