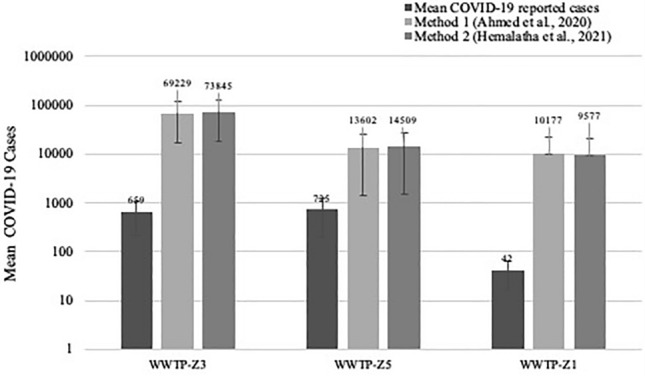
Fig. 4.

Reported and Predicted COVID 19 infected cases across 3 WWTPs. The figure represents mean of week-wise COVID-19 reported cases and predicted infected individuals using Ahmed et al. (2020) and Hemalatha et al. (2021) methods using Wastewater-based Epidemiology approach. The correlation between reported and predicted COVID-19 cases was significant (p < 0.05) among WWTP-Z3 and Z5 and vice-versa
