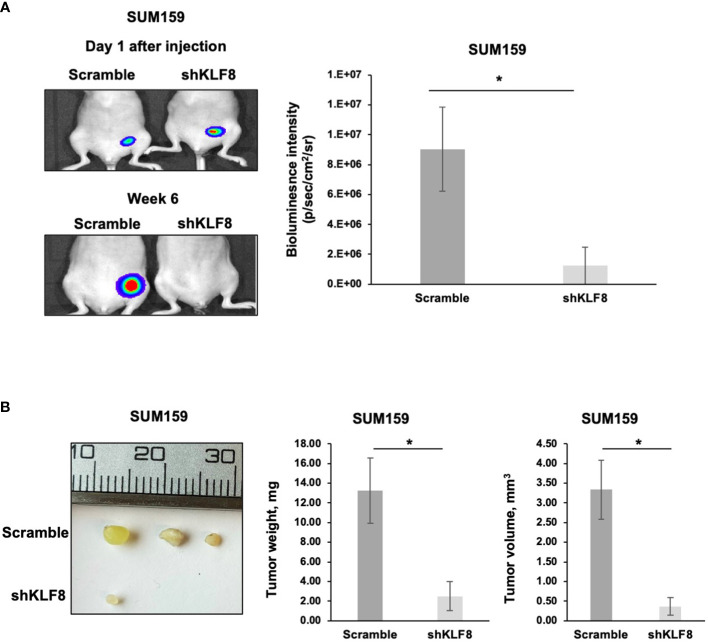
Figure 6.
Reduced KLF8 expression impaired breast tumor growth in vivo. (A) Representative images of tumors in immune-compromised mice, formed from MDA-MB-231 cells stably expressing luciferase, transduced with control or KLF8 shRNA 1 day and 6 weeks after injection (left). Quantified graph showing bioluminescence signal from tumors formed from MDA-MB-231 cells stably expressing luciferase, transduced with control (n=4) or KLF8 (n=4) shRNA, 6 weeks after injection (right). (B) Representative images of tumors formed from MDA-MB-231 cells stably expressing luciferase, transduced with control or KLF8 shRNA, taken from mammary fat pad of immune-compromised mice 6 weeks after injection (left). Quantified graph showing weight of tumors formed from MDA-MB-231 cells stably expressing luciferase, transduced with control (n=4) or KLF8 (n=4) shRNA (middle). Quantified graph showing volume of tumors formed from TNBC cells MDA-MB-231 stably expressing luciferase, transduced with control (n=4) or KLF8 (n=4) shRNA (right). Student t test reported as mean ± SEM, *p<0.05.

