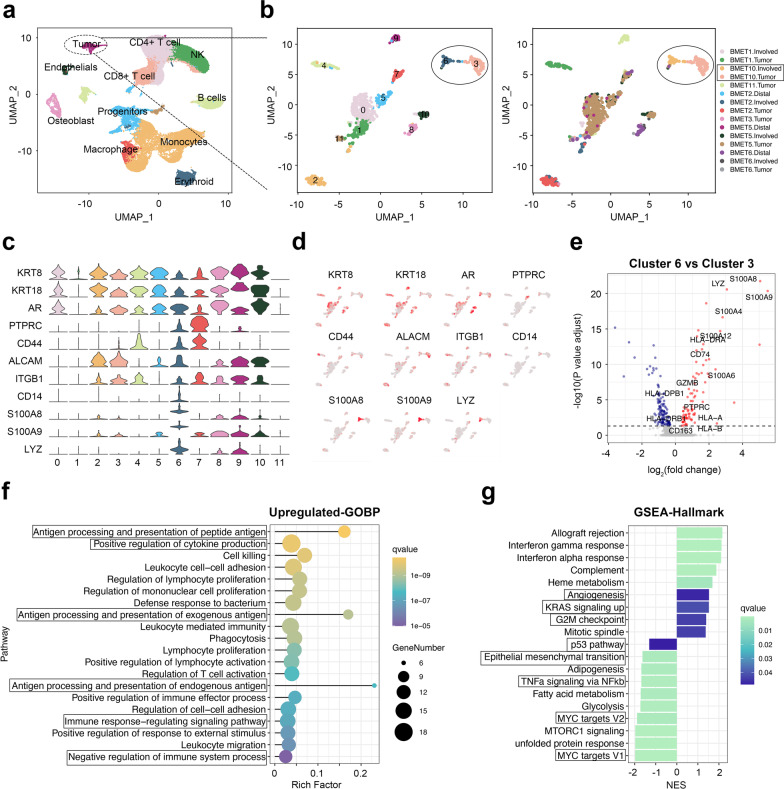
Fig. 1.
Identification of myeloid-like disseminated cancer cells in the bone marrow of patients with PCa bone metastasis. a UMAP plots showing the populations of 55,276 cells from the three combined scRNA-seq (tumor in bone, involved marrow, and distal marrow) of patients with PCa, colored by cell annotation. b UMAP plots showing the transcription heterogeneity of tumor cells colored by cell cluster (left) and sample type (right). d Dot plots showing the average expression level of known markers in tumor cells from different types of samples. c UMAP plots showing the expression level of selected genes in tumor cells. e Volcano plots showing the differentially expressed genes between myeloid-like tumor cells and normal tumor cells. f Dot plot showing GO enrichment analysis of up-regulated genes in myeloid-like tumor cells. g Bar plot showing the result of GSEA of hallmark pathways in cluster 6 (myeloid-like tumor cells) compared with cluster 3

