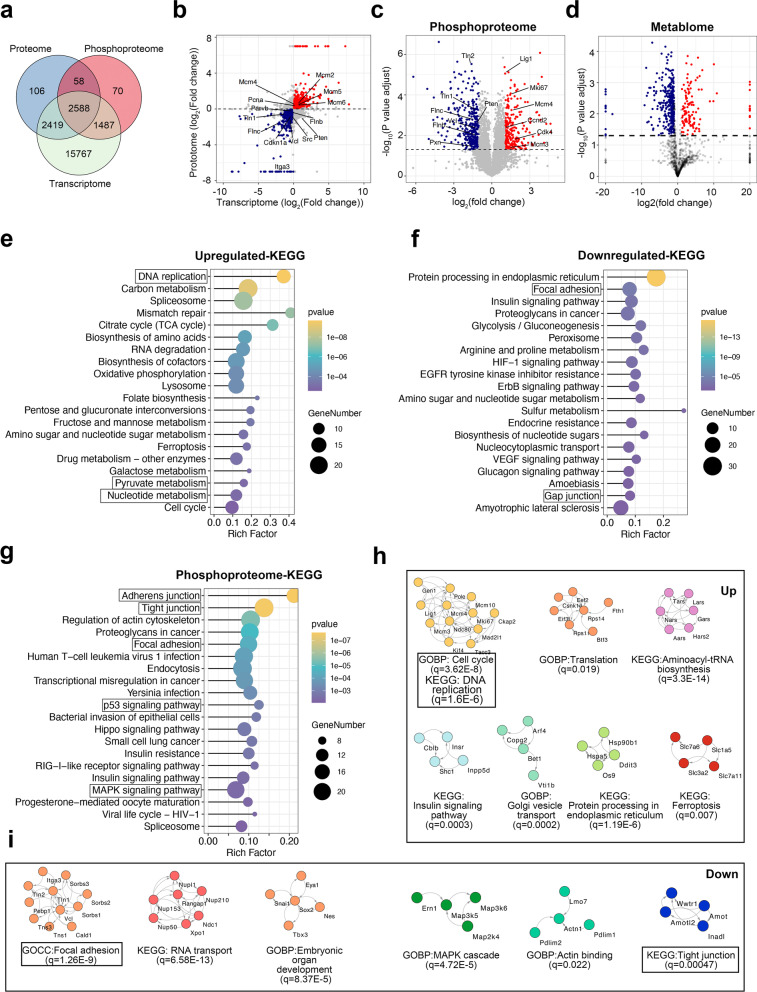
Fig. 3.
Multi-omics analysis reveals the difference between parental RM1 and hybrid cells. a Venn diagram showing the overlap of detected genes, proteins, and phosphoproteins. b Volcano plot showing the common genes in the transcriptome and proteome. c Volcano plot showing the proteins with different phosphorylation status between parental RM1 and hybrid tumor cells. d Volcano plot showing the different abundance of metabolites between RM1 cells and hybrid tumor cells. e, f KEGG enrichment analysis of the commonly up-regulated genes (e) and down-regulated genes (f) in both the transcriptome and proteome. g KEGG enrichment analysis of the proteins with different phosphorylation statuses between parental RM1 and hybrid tumor cells. h, i Functional STRING network of the proteins with significantly higher phosphorylation status (h) or lower phosphorylation status (i) in hybrid cells

