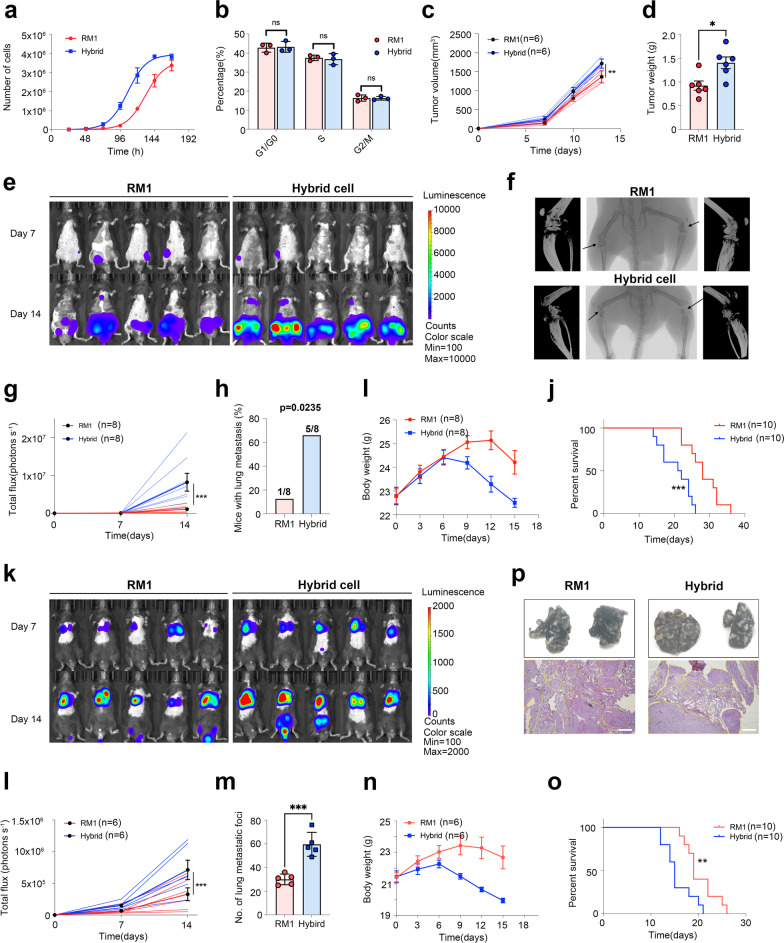
Fig. 4.
Tumor hybrid cells show a higher proliferative and metastatic capacity. a The growth curves of RM1 cells and hybrid cells in vitro (5000 cell/well initials, n = 3). b The proportion of RM1 cells and hybrid cells in different cell phases (n = 3). c The growth curve of RM1 tumors or hybrid tumors in vivo (5 × 10.5 cells per mouse, subcutaneously injected, n = 6). d Tumor weight measured at the endpoint of the experiment (n = 6). e Representative bioluminescence images of bone metastasis in mice after inoculation with RM1 or hybrid cells through the caudal artery (n = 8). f Representative micro-CT images of mice with bone metastases in the RM1 group and hybrid cell group. g The growth kinetics of tumor bioluminescence in mice after inoculation with RM1 or hybrid cells through the caudal artery (n = 8). h The percentage of mice with lung metastasis in the RM1 group and hybrid tumor cell group. i The change in body weight in mice after inoculation with RM1 or hybrid cells through the caudal artery (n = 8). j Survival curve of mice with bone metastasis in the RM1 group and hybrid cell group (n = 10). k–o Representative bioluminescence images (k), growth kinetics of bioluminescence (l, n = 6), number of lung metastatic foci (m, n = 5), body weight (n, n = 6), and survival curve (o, n = 10) of mice after inoculation with RM1 or hybrid cells through the tail vein. p Representative images of lungs with metastatic foci (upper, arrow indicated tumor tissue), and H&E-stained lung slices (lower) in the RM1 group and hybrid tumor cell group. ns Not significant, *P < 0.05; **P < 0.01; ***P < 0.001

