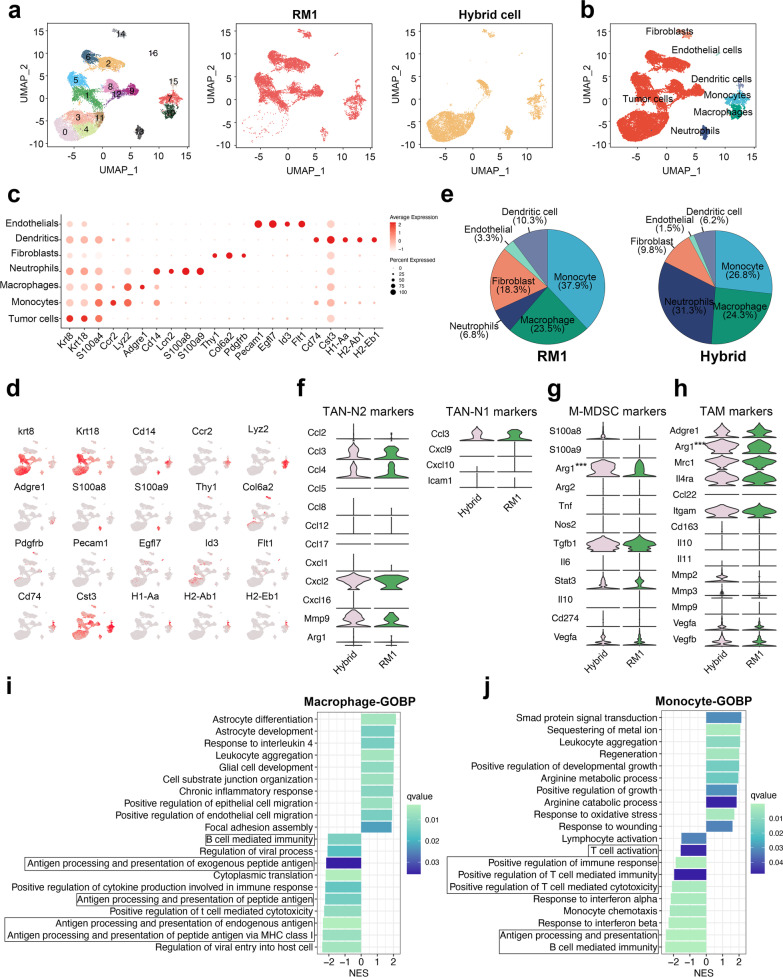
Fig. 5.
Single-cell RNA sequencing reveals the tumor microenvironment in RM1 and hybrid cell-derived tumors. a UMAP plots showing the 17 identified clusters of 17,602 cells from scRNA-seq of RM1-derived tumor and hybrid cell-derived tumor. The cells from RM1-derived tumor (middle) and hybrid cell-derived tumor (right) are shown. b UMAP plots showing the clusters colored by cell type. c Dot plots showing the expression level of known markers for each cell type. d UAMP plot showing the expression level of selected genes in all cells. e Pie plots showing the components of non-tumor cells colored by cell annotation. f–h Violin plot showing the expression of N1 TAN markers and N2 TAN markers in neutrophils (f), M-MDSC markers in monocytes (g), TAM markers in macrophages (h) from RM1-derived and hybrid cell-derived tumors. i, j Bar plots showing the results of GSEA of GOBP pathways in monocytes (i) and macrophages (j) from hybrid cell-derived tumors compared with those from RM1-derived tumors. ***P < 0.001

