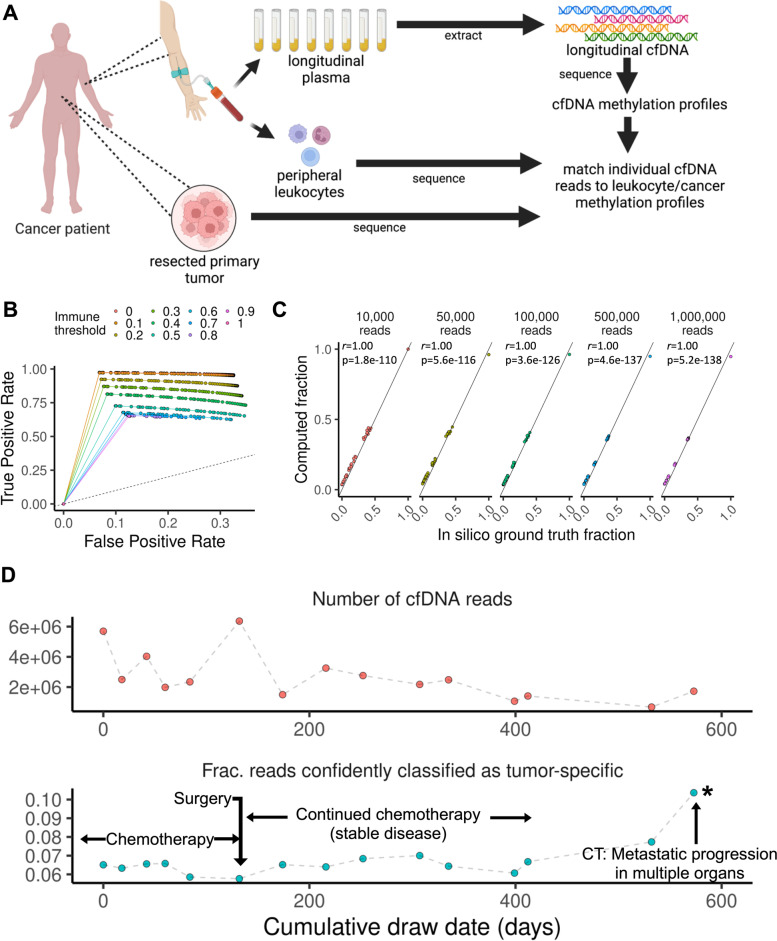
Fig. 2.
Single-molecule methylated sequence classification. A Overview of method. For a given patient, matched primary tumor tissue and peripheral leukocytes were obtained as reference samples alongside longitudinal plasma samples. Methylation data from the cfDNA is then classified leveraging the methylation profile of the reference samples. B Classification accuracy. We used GP2D and healthy donor-derived nucleosome mixtures to validate the classification procedure. ROC curves are plotted, where each curve represents a distinct immune threshold score. The curve is plotted by varying the cancer threshold score. C Admixture validation. The proportion of reads classified as belonging to cell line reference is plotted as a function of the actual admixture ratio and sequencing depth. D Longitudinal methylation profiles of patient-derived cfDNA in colorectal cancer. The overall cfDNA sequencing yield (upper panel) is plotted against the number of reads with methylation profiles matching that of the matched tumor with a calculated score of > 0.9 (lower panel). Clinically relevant events are annotated; significant corresponding changes in tumor-specific cfDNA are marked with an asterisk. CT refers to computed tomography imaging

