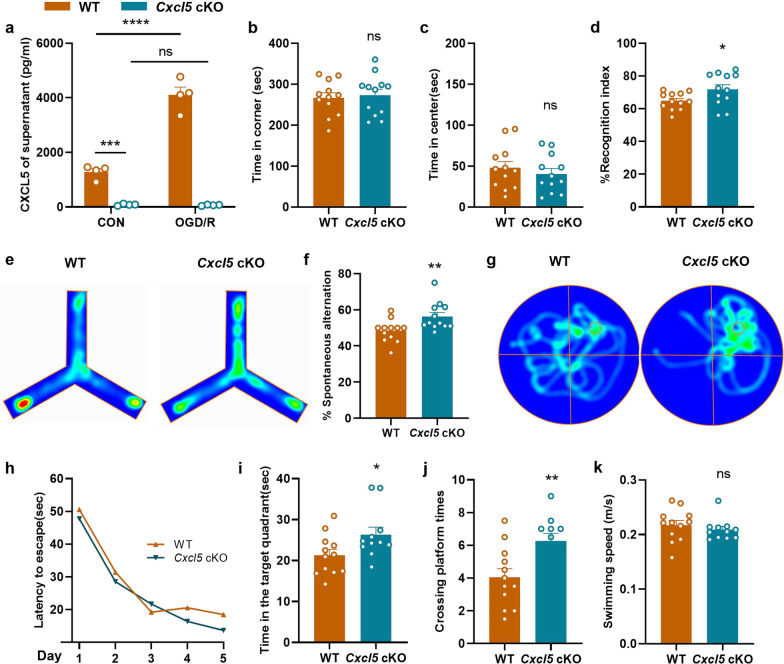
Fig. 2.
Astrocyte specific Cxcl5 deficiency alleviated cognitive decline in BCAS model. a The result of CXCL5 concentration in the supernatant of primary astrocytes in the WT and Cxcl5 cKO groups after OGD/R 12 h by ELISA. n = 4 per group. b, c Results of the OFT showing the time spent in the corner area (b) and center area (c) in the WT and Cxcl5 cKO groups at 2 months after surgery. n = 12 per group. d Results of the NOR showing the recognition index percentage. n = 12 per group. e, f Results of Y-maze tests showing representative heatmaps (e) and the spontaneous alternation percentage (f). n = 12 per group. g–k Results of the MWM test. Representative heatmaps (g), escape latency during the acquisition phase (Days 1–5) (h), the time in target quadrant (i), the crossing platform times (j) and the swimming speed (k) of the probe test (Day 6). n = 11–12 per group. All data were presented as the mean ± SEM. *p < 0.05, **p < 0.01, ***p < 0.001, ****p < 0.0001, ns means no significance. Two-way ANOVA with Bonferroni's post hoc test for a and h. Student’s t-test for b–d, j. Mann–Whitney test for f, i, k

