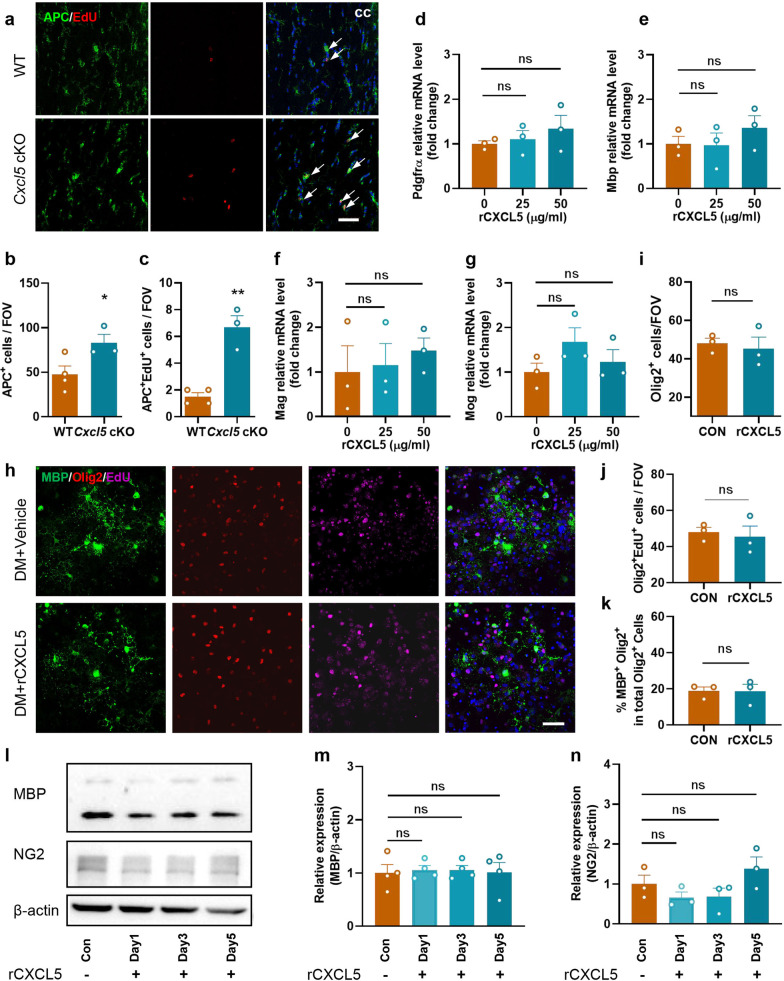
Fig. 4.
CXCL5 exerted no significant impact on the fate of OPCs. a–c Representative EdU staining and immunostaining APC (a) and quantification of APC+ cell (b) and EdU+APC+ cell (c) numbers per FOV in the CC in the WT and Cxcl5 cKO groups at 2 months after surgery. Scale bar = 50 μm. n = 3–4 per group. d–g The primary OPCs were treated with 25 or 50 μg/ml of rCXCL5 in differentiating medium for 3 days. The mRNA level of OPCs marker Pdgfrα (d) and OLs markers Mbp (e), Mag (f) and Mog (g) was measured by qPCR. n = 3 per group. h–k Primary OPCs were pretreated with rCXCL5 in differentiating medium, and then treated with 10 µM EdU for 24 h. h Primary oligodendrocyte lineage cells were labeled by immunofluorescence staining of MBP (green), Olig2 (red) and EdU (pink). Scale bar = 50 μm. i Quantification of Olig2+ cell numbers in the control and rCXCL5 groups. j Quantification of Olig2+EdU+ cell numbers in the control and rCXCL5 groups. k Quantification of the ratio of MBP+Olig2+ cells among total Olig2+ cells in the control and rCXCL5 groups. n = 3 per group. l–n At the days 1, 3 and 5 during the differentiation phase of OPCs, rCXCL5 was added to the differentiating medium, and finally OLs were collected on day 7. Representative immunoblot bands (l) and quantification of MBP (m) and NG2 (n) normalized to β-actin in OLs. n = 3–4 per group. All data were presented as the mean ± SEM. *p < 0.05, **p < 0.01, ns means no significance. DM: differentiating medium. Student’s t-test for b, c, i, j and k. One-way ANOVA with Tukey’s post-hoc for d–g, m and n

