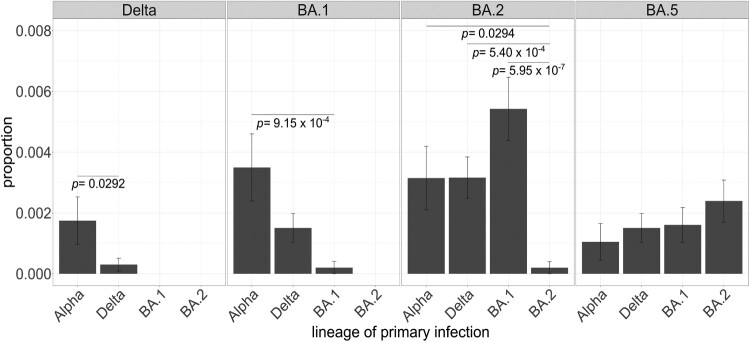
Figure 3.
Proportion of primary infections in lineage-causing reinfections. Each panel encompasses the lineage causing the secondary infection and each bar represents the number of reinfection cases by lineage causing the primary infection normalized by the total number of cases assigned to that lineage throughout the study period. Fisher’s exact tests with post hoc Holm correction were applied to test the significance of the intra-group differences. Only significantly different comparisons are shown. Error bars represent the standard error of sample proportion. Reinfection cases with primary infection with n = 1 were excluded.

