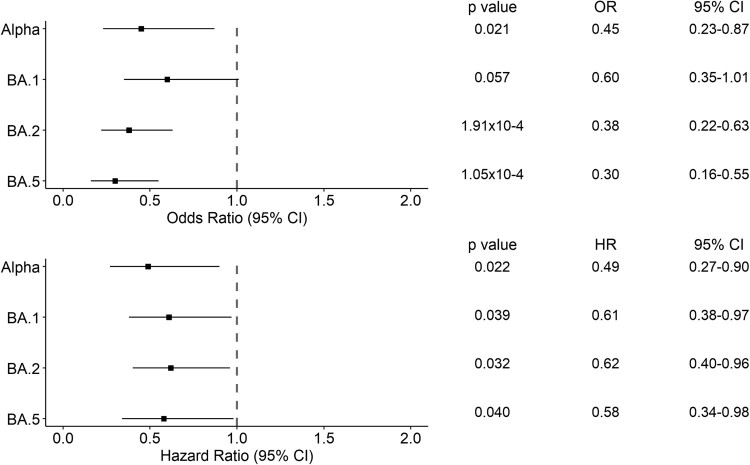
Figure 5.
Forest plots of the 28-day hospital mortality associated with the presence of a variant of concern compared to Delta. The upper panel shows the estimated odds ratio (OR) and the 95% confidence interval (CI) from the logistic regression analysis. The lower panel shows the hazard ratio (HR) and the 95% CI from the Cox regression analysis. P-values are also reported.

