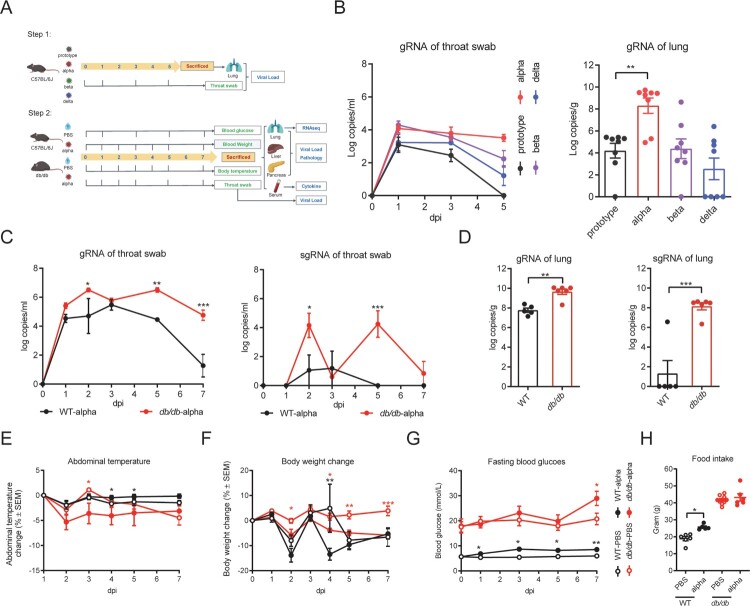
Figure 1.
Detection of respiratory viral load and clinical characteristics during infection. (A) Flow chart of experimental protocol. (B) Viral load in throat swabs of WT mice infected with different strains and lung viral load on day 5 after infected with different strains in WT mice. (C) Viral gRNA and sgRNA in throat swabs of db/db and WT mice after infection. (D) Lung viral gRNA and sgRNA of db/db and WT mice on 7 dpi. (E) Abdominal temperature change after infection. (F) Body weight change percentage after infection. (G) Fasting blood glucose after infection. (H) Food intake for seven days. (C) (E-G) were analysed by one-way ANOVA with Tukey’s posttest, red * present the differences between infected and uninfected db/db mice and black * present the differences between infected and uninfected WT mice. (D) (H) were analysed by unpaired t-test. *p < 0.05, **p < 0.01, ***p < 0.001. All data were shown as mean ± SEM.

