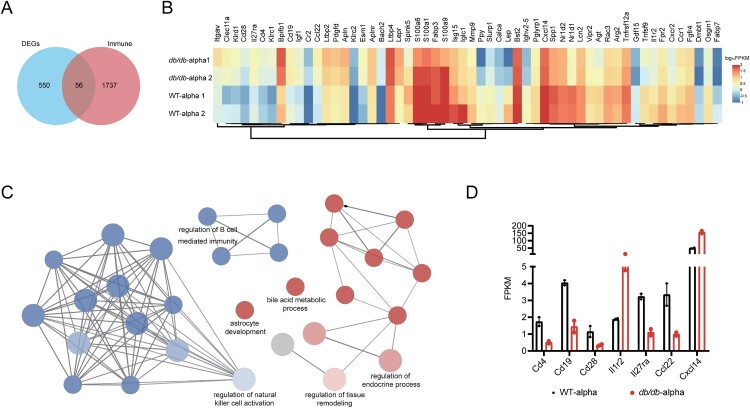
Figure 4.
Analysis of immune-related DEGs in the lungs of db/db and WT mice after infection. (A) Veen diagram of DEGs in the infected db/db and WT mice and immune-related genes. DEGs were presented in blue, and immune-related genes were presented in red. (B) Heat map of expression of immune-related differential genes. (C) The network of GO enriched terms of DEGs. The term significant was presented by the node size: the biggest terms were the most significant ones. The proportion of associated upregulated or downregulated genes was showed with the node colour: red colour indicated more upregulated genes was enriched to the term, and blue colour indicated more downregulated genes. (D) FPKM values of some genes encoding immune cell surface antigens and cytokines in db/db and WT mice.

