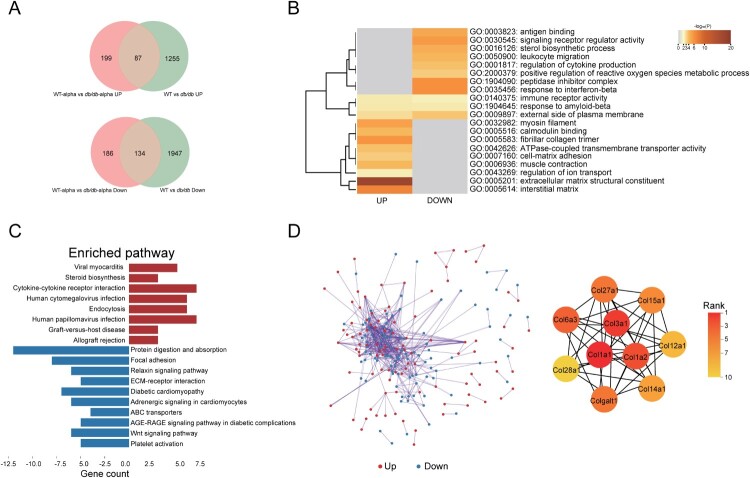
Figure 5.
Analysis of SARS-CoV-2 related DEGs in the lungs of db/db and WT mice after infection. (A)Veen diagram of different genes. Genes of infected mice were presented in red, and genes of uninfected mice were presented in green. (B)The GO enrichment of upregulated DEGs and downregulate DEGs. The top 20 results were shown in heatmap. The darker the colour, the smaller the p-value. (C) The KEGG pathway enrichment analysis of DEGs. Results from KEGG enrichment of upregulated genes (red) and downregulated genes (blue) were showed in bar graph. (D) The PPI network of all DEGs. The upregulated genes were marked in red, while the down-regulated genes were marked in blue. Ten hub genes were identified with the MCC algorithm using cytoHubba.

