
Fig. 4.
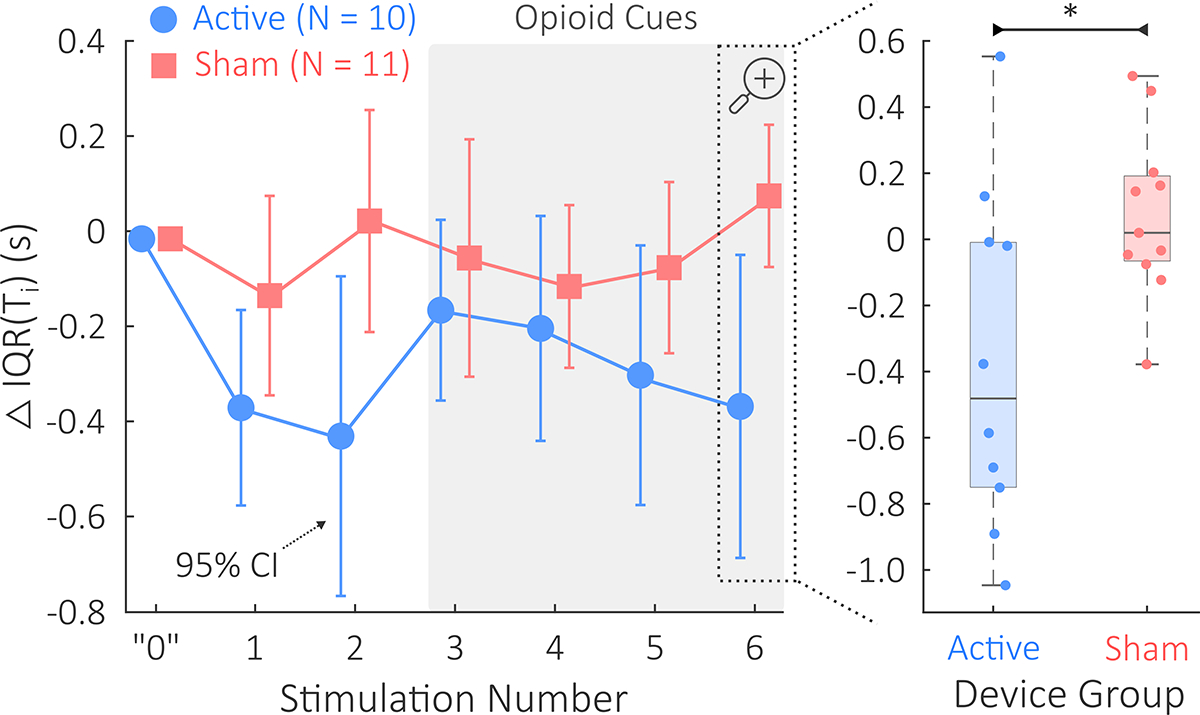
This study’s primary finding: IQR(Ti) comparison between the active tcVNS and sham stimulation groups. Δ denotes changes relative to baseline. On the left, mean ΔIQR(Ti) and 95% confidence intervals are shown during each of the six administrations of active or sham stimulation. The horizontal shift between active and sham data is used for the purpose of visualization; measurements were taken equivalently. A gray background is used to highlight opioid cue presentation during stimulations 3–6. The “0” shown represents baseline. On the right, we see that the final ΔIQR(Ti) was significantly lower in the active group compared to the sham group (p < .05, denoted by *).Horizontal jitter is used to overlay the patient-specific datapoints.