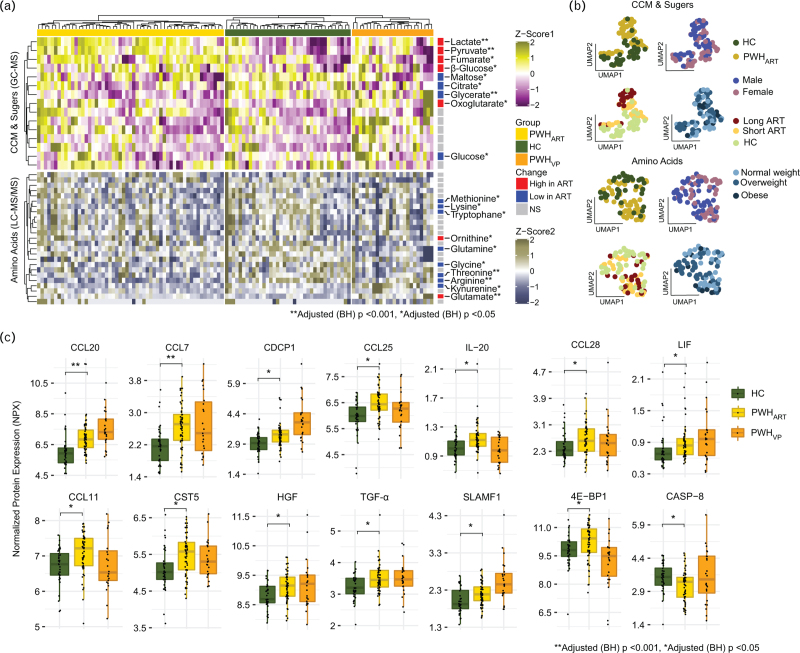
Fig. 2.
Dysregulated central carbon and amino acid metabolism together with elevated levels of inflammatory markers in PWHART.
(a) Heatmap showing metabolite abundance pattern of targeted metabolomics data. Normalized levels of central carbon metabolism (CCM), sugar metabolites and amino acids are shown from the cohorts. Column annotation denotes the study cohorts and right annotation shows the metabolite levels in PWHART compared to HC. Significantly changed metabolites in PWHART compared to HC are labelled. (b) Sample distribution based on targeted metabolomics data of CCM, sugar metabolites and amino acids by UMAP dimensionality reduction. Individual UMAPs are coloured in respective category for cohort, gender, duration of treatment, and BMI. (c) Boxplot of significantly regulated proteins in PWHART compared to HC (adj.P < 0.05). Statistical significance was determined using Mann−Whitney U-test (adjusted P < 0.05). HC, HIV-1 negative controls; PWHART, people with HIV on antiretroviral therapy; UMAP, uniform manifold approximation and projection.

