Fig. 3.
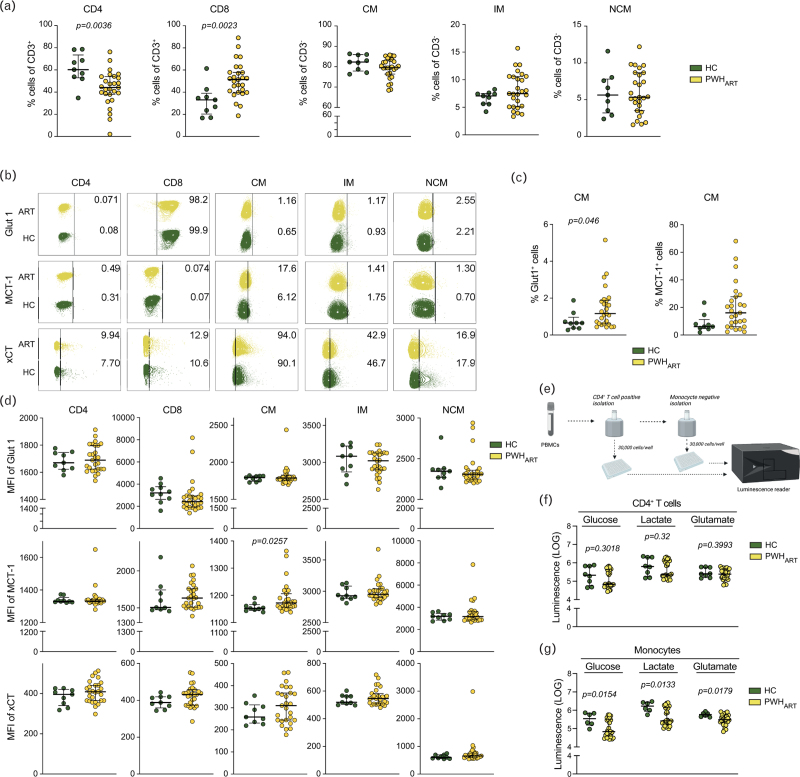
Intracellular metabolites and transport are dysregulated in monocytes during suppressive HIV-1 infection.
Metabolite uptake and secretion in HC (n = 9) and PWHART (n = 27). (a) Proportion of CD4+ and CD8+ T cells and classical (CM), intermediate (IM), and nonclassical (NCM) monocytes in PBMCs. (b) Contour plots showing percentage of cells expressing Glut1, MCT-1, and xCT in CD4+, CD8+, CM, IM, and NCM. The contour plots show a representing sample in each group with the median expression level within that group. (c) Percentage of CM expressing Glut1 or MCT-1 PWHART and HC. (d) Median fluorescence intensity (MFI) of Glut1, MCT-1, and xCT expression on CD4+, CD8+, CM, IM, and NCM cell populations in HC and PWHART. (e) Schematic representation of CD4+ and monocyte isolation for intracellular metabolite measurement. (f) Intracellular measurement of glucose, lactate, and glutamate in a cohort of HC (n = 8) and PWHART (n = 28) in CD4+ T cells. (g) Intracellular measurement of glucose, lactate, and glutamate in a cohort of HC (n = 6) and PWHART (n = 27) in monocytes. Statistical significance was evaluated using Mann−Whitney U-test (P < 0.05) and represented as median with interquartile range (IQR). See also Figure S1. HC, HIV-1 negative controls; IQR, interquartile range; MUVR, multivariate methods with unbiased variable selection in R; PWHART, people with HIV on antiretroviral therapy; UMAP, uniform manifold approximation and projection.

