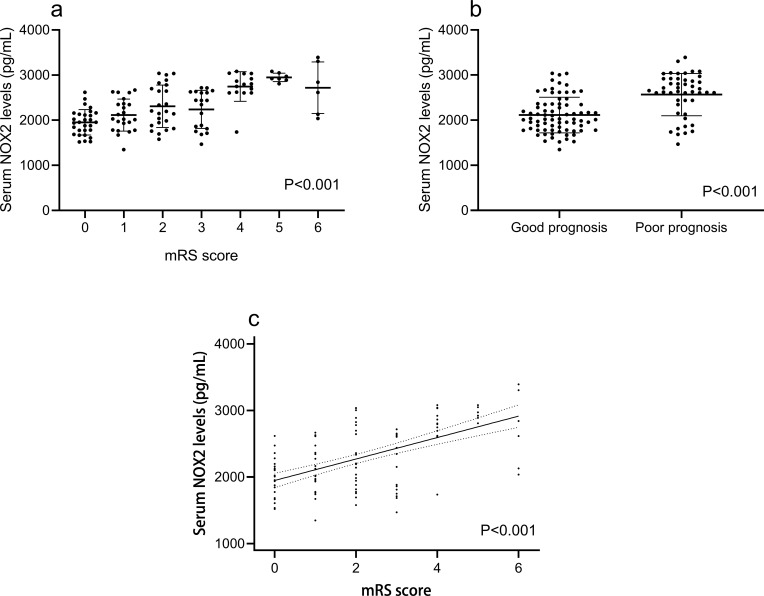
Figure 4.
Boxplots and correlograms. (a) Correlograms illustrating the relationship between patients’ serum NOX2 levels and modified Rankin scale, using the Spearman correlation coefficient. (b) Boxplots illustrating serum NOX2 levels among patients with different modified Rankin scale score. Patients were divided into seven groups in accordance with modified Rankin scale score. Data were compared among multiple groups using Kruskal–Wallis H-test. (c) Boxplots illustrating serum NOX2 levels between two groups named good prognosis and poor prognosis. A poor prognosis was defined as modified Rankin scale score of 3–6. The data of two groups were compared using Mann–Whitney U-test.

