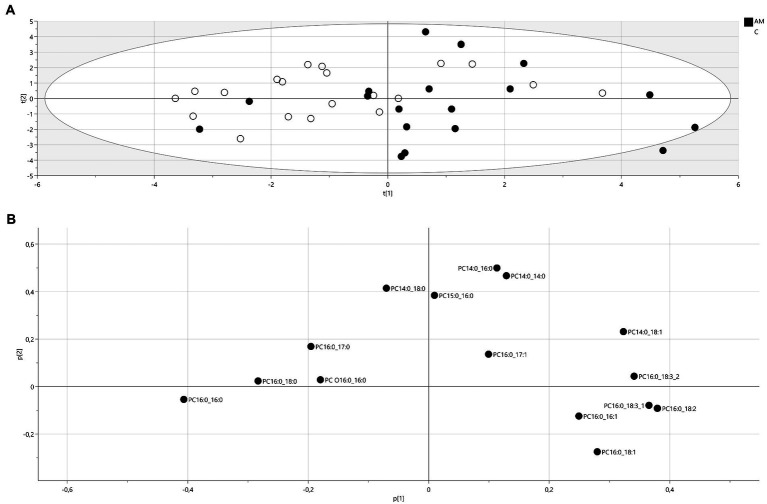
Figure 2.
Principal component analysis (A) score plot of PC lipids (R2X(cum) = 0.575, Q2 (cum) = 0.282), filled circles: AM operators, unfilled circles: controls. t(1): first principal component, t(2):second principal component and (B) corresponding loadings plot. A variable with a positive loading is positively correlated to the principal component, and negative loadings indicate a negative correlation. PC: phosphatidylcholine, number of carbons:number of double bonds.

