FIGURE 2.
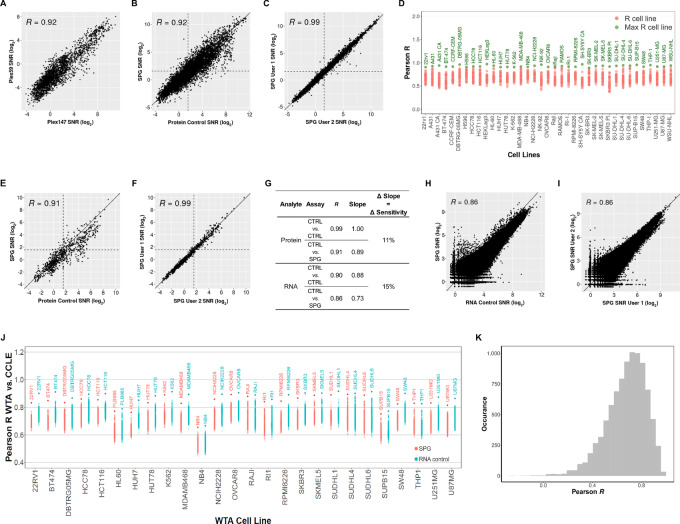
Assessment of SPG data quality versus the respective RNA and Protein control data. Assay correlation with respect to the protein analyte comparing 147-plex and 59-plex protein panel (A), protein control and proteogenomic workflows (B), and user-to-user and instrument-to-instrument reproducibility (C). D, Cell line to cell line comparison of protein control with proteogenomic protein data. For protein targets with SNR ≥ 3, the Pearson R was calculated between each cell line from the Protein Control slide against all the cell lines in the SPG slide. The max R cell line between the SPG and Protein control is labeled and highlighted green. Assay correlation of 17 phospho-specific antibodies between protein control and proteogenomic workflows (E) and user-to-user and instrument-to-instrument reproducibility (F). G, Assay correlation with respect to the RNA analyte comparing summary of Pearson R, the slope of linear regression, and change in sensitivity between workflows. The change in sensitivity corresponds to the average change in regression line slope between the SPG and the single-analyte control assay. RNA control and proteogenomic workflows (H) and user-to-user and instrument-to-instrument reproducibility (I). J, Cell line to cell line comparison of WTA control and proteogenomic WTA data to the entire CCLE RNA-seq dataset. For all overlapping targets between the CCLE and WTA data, the Pearson R in the protein control and SPG WTA data were calculated against all cell lines in the CCLE RNA-seq. Cell line labels in the plot correspond to SPG or GeoMx WTA cell lines with the highest R correlation to the CCLE data. K, Target-to-target comparison of WTA control to proteogenomic WTA data. For each RNA target with SNR ≥ 4, the Pearson R was calculated between WTA control log2 SNR transformed data and the respective proteogenomic WTA log2 SNR transformed data. Histogram shows the distribution of Pearson R.

