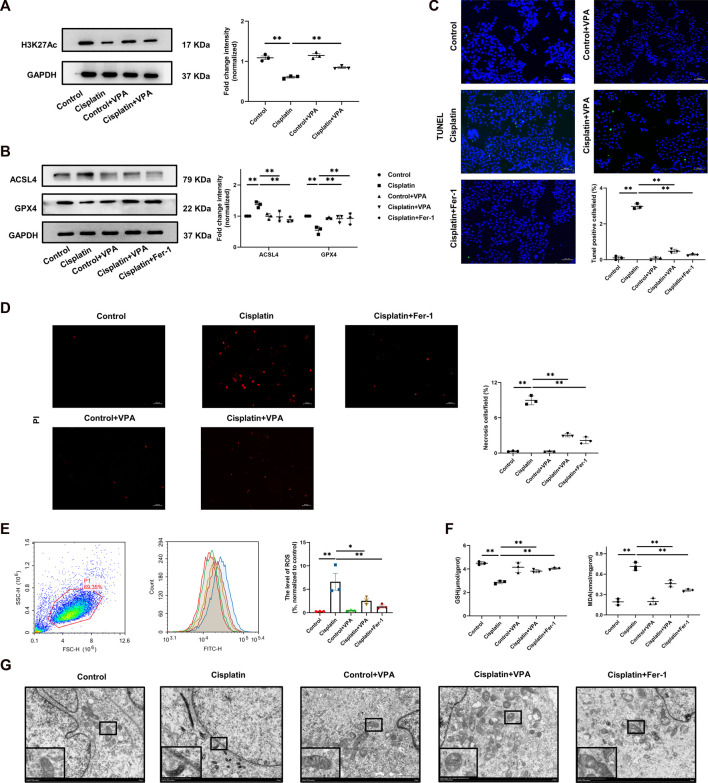
FIGURE 5.
The cisplatin-induced ferroptosis is improved by VPA in HK-2 cells. Representative images of Western Blot and quantification of H3K27Ac in HK-2 cells stimulated by cisplatin (A). Representative images of Western blot and quantification of ACSL4 and GPX4 in HK-2 cells stimulated by cisplatin (B). PI staining (red) and statistical analysis of cell death in each group in HK-2 cells stimulated by cisplatin. Scale bar = 50 μm (C). TUNEL fluorescence staining and statistical analysis of apoptosis cells in each group in HK-2 cells stimulated by cisplatin. Green fluorescence in pictures represent positive signals of apoptosis cells, while blue fluorescence represents nuclear staining (D), Scale bar = 200 μm. The production of ROS was detected by ROS assay kit and was present as FITC-H value in P1 region (E). The production of GSH and MDA in cisplatin-stimulated HK-2 cells (F). Transmission electron microscopy of HK-2 cell treated with cisplatin, VPA or Fer-1 (G), Scale bar = 2 μm. n = 3. ✱✱ value p < 0.01, ✱ value p < 0.05. Statistically analyzed via a one-way ANOVA.

