FIGURE 10.

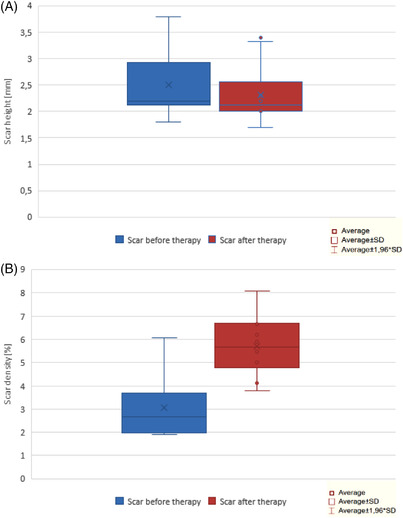
The results of the measurements the scar height (A) and structure (B) before and after manual therapy; average, average ± SD, and average ± 1.96*SD

The results of the measurements the scar height (A) and structure (B) before and after manual therapy; average, average ± SD, and average ± 1.96*SD