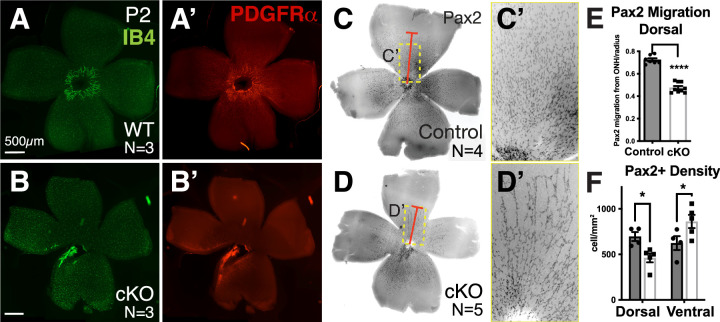
Figure 4.
Fewer astrocyte precursors were observed in Tbx3 cKO retinas, starting as early as P2. (A, B) Endothelial cells are marked with IB4 (green) in WT and Tbx3 cKO flatmounted retinas at P2. (A’, B’) Same samples immunostained for astrocyte precursors using anti-PDGFRα antibody. (C, D) Inverse images of flatmount retinas from P2 WT and Tbx3 cKO mice stained with a second astrocyte precursor marker, anti-Pax2 antibody (black). The red bar marks Pax2+ cells farthest away from the optic nerve head in each panel. The dashed yellow box indicates images magnified in panels C’ and D’. (E) Quantitation of Pax2+ cells farthest away from the optic nerve head in heterozygote (gray indicates control, N = 4) and cKO (white bar, N = 5) retinas. Distance is an averaged measure of 10 cells per dorsal and another 10 per ventral. (F) Graph shows quantitation of the percentage of surface area occupied by dorsal and ventral retinas in control (gray) and cKO (white) retinas. (G) Quantitation of Pax2+ cell density in dorsal and ventral regions of control (gray) and cKO (white) retinas. Statistical significance was determined using an unpaired t-test (E) and a two-way ANOVA with Šídák's multiple comparisons test (F). *P > 0.05; **** P < 0.0001.

