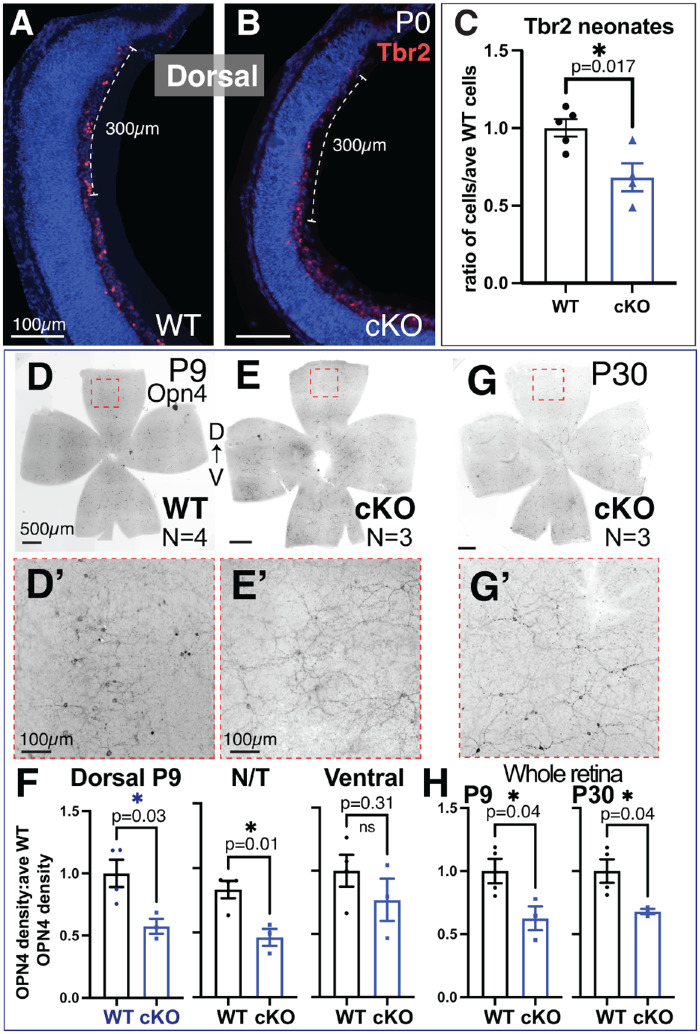
Figure 7.
Reduction of ipRGCs in dorsal Tbx3 cKO retinas starting at birth. (A, B) Cryostat sections (20 µm) of P0 retinas from WT and Tbx3 cKO mice immunostained with an anti-Tbr2 antibody marking early ipRGCs. Dashed bar indicates 300-µm area of Tbr2+ cells counted in the dorsal and central retinal sections. (C) Graph of the quantitation of Tbr2+ cells in P0 and P1 dorsal retinas (WT, N = 5; cKO, N = 4). An unpaired, two-tailed t-test was used to determine statistical significance. (D–E’) Inverse images of P9 flatmount WT and cKO retinas immunostained with anti-OPN4 antibody marking differentiated ipRGCs. The dashed box shows the area magnified in D’ and E’. Density of cells was measured in dorsal, nasal/temporal (N/T), and ventral petals and normalized to WT siblings. (F) Graphs showing quantitation of OPN4+ cells in each region. (G) Inverse image of P30 cKO flatmount with magnified area (dashed box) shown in panel G’. (H) Graphs of OPN4+ cells per whole retina of P9 (WT, N = 4; cKO, N = 3) and P30 samples (WT, N = 4; cKO, N = 3). Unpaired, two-tailed t-tests were used to determine statistical significance; P values are shown on the graphs in C, F, and H.

