Figure 1.
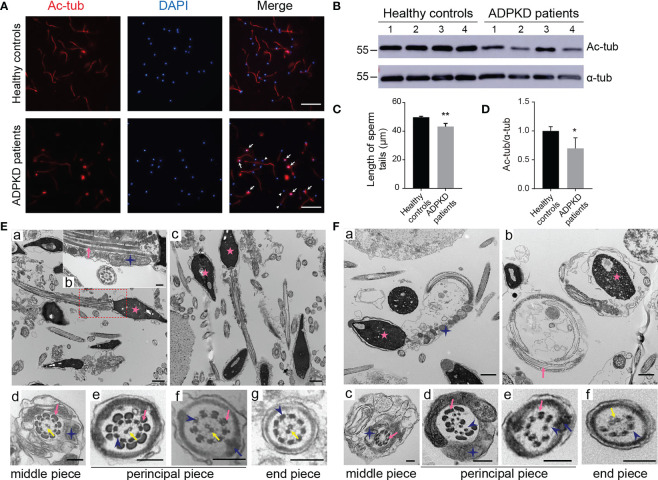
Morphology of sperm from healthy controls and ADPKD patients. (A) Immunofluorescence staining of sperms. White arrows indicate curled sperm flagella stained with acetylated α-tubulin (red signal) in ADPKD patients. White arrowheads indicate small sperm heads stained with 4’,6-diamidino-2-phenylindole (DAPI) (blue signal). Scale bar: 50μm. (B) Representative western blotting images of acetylated α-tubulin and α-tubulin in sperms from healthy controls and ADPKD patients (n=4). (C) Comparison of sperm tail length between controls and ADPKD patients (n=4). At least 30 sperms were counted from each individual observed from three random fields per slide. (D) Relative intensities of acetylated α-tubulin/α-tubulin in sperms. (E) Ultrastructure of sperm flagella from healthy controls. (a, c) Longitudinal sections of normal spermatozoa with straight sperm tails. (b) Magnification of the dotted area in (a). (d-g) Cross-sections of spermatozoa at various levels with regular arrangement of axonemes. (F) Ultrastructure of sperm flagella from ADPKD patients. (a, b) Sperm flagella in ADPKD patients are coiled and wrapped around the heads. (c-f) Disruption of axonemes or outer dense fibers in the cross-section of sperm tails. Blue stars indicate mitochondria, pink arrows indicate outer dense fibers, blue arrows indicate fibrous sheath, yellow arrows indicate central axoneme; blue arrowheads indicate peripheral axonemes, and pink stars indicate nuclei. Scale bars: Ea, Ec, Fa, Fb: 1μm; Eb, Ed-g, Fc-f: 200nm. Error bars indicate standard deviation of three independent experiments (*P < 0.05, **P < 0.01; Student’s t test).

