Figure 2.
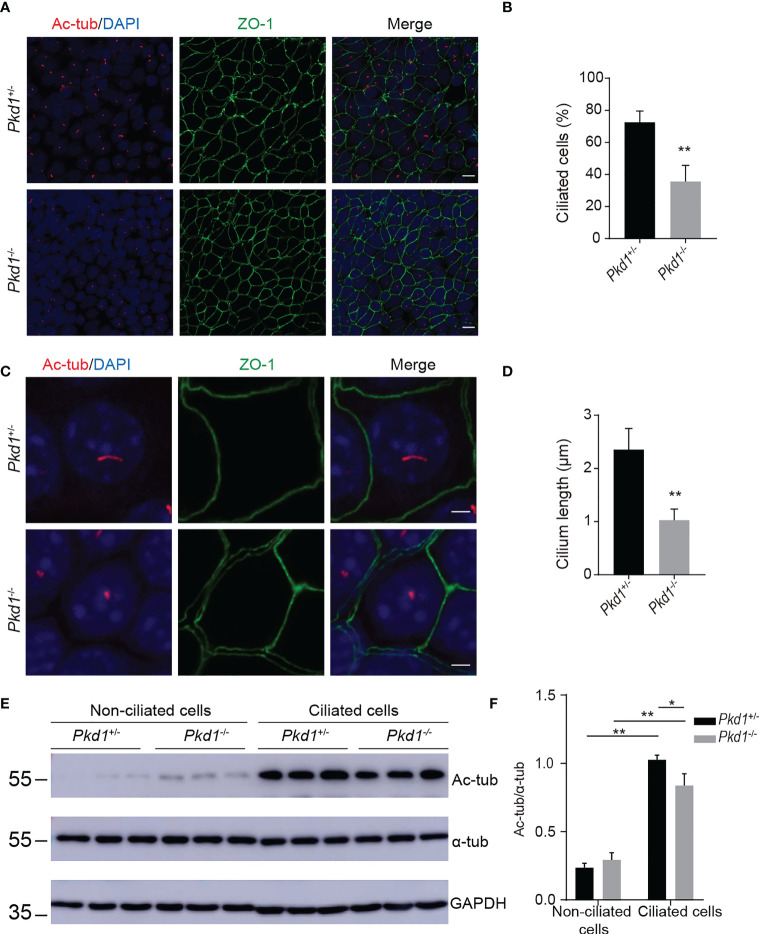
Compromised ciliary integrity in Pkd1-depleted mouse kidney tubule cells. (A) Immunofluorescence images of homozygous or heterozygous Pkd1- knockout cells. Cilia and tight junctions were stained with acetylated α-tubulin (red) and ZO-1 (green), respectively. Nuclei were stained with DAPI (blue). Scale bar: 25μm. (B) Percentage of ciliated cells in Pkd1+/- or Pkd1-/- cells. At least 200 cells were counted from three random fields per slide. (C) Ciliary morphology in Pkd1+/- or Pkd1-/- cells. Scale bar: 2.5μm. (D) Quantifications of cilia length in Pkd1+/- or Pkd1-/- cells. At least 50 cells were counted from three random fields per slide. (E) Representative western blotting images of acetylated α-tubulin (Ac-tub) and α-tubulin (α-tub) with GAPDH loading control in non-ciliated and ciliated Pkd1-depleted mouse kidney tubule cells. (F) Relative intensities of acetylated α-tubulin/α-tubulin in cells. Error bars indicate standard deviation of three independent experiments (*P < 0.05, **P < 0.01; Student’s t test).

