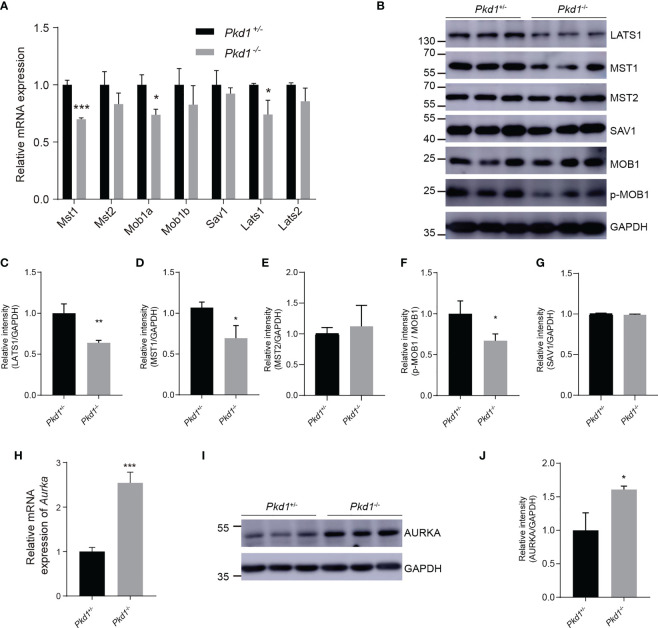
Figure 4.
The restrained Hippo signaling pathway and increased AURKA. (A) Relative mRNA expression of core components of the Hippo kinase cascade. (B) Representative western blotting images of core components of the Hippo signaling pathway with GAPDH as the loading control. (C–G) Relative intensities of LATS1, MST1, MST2, p-MOB1, and SAV1, respectively. (H) Relative mRNA expression of Aurka in Pkd1+/- and Pkd1-/- cells. (I) Representative western blotting images of AURKA. (J) Relative intensity of AURKA. All error bars indicate standard deviation of three independent experiments (*P < 0.05, **P < 0.01, ***P < 0.001; Student’s t test).

