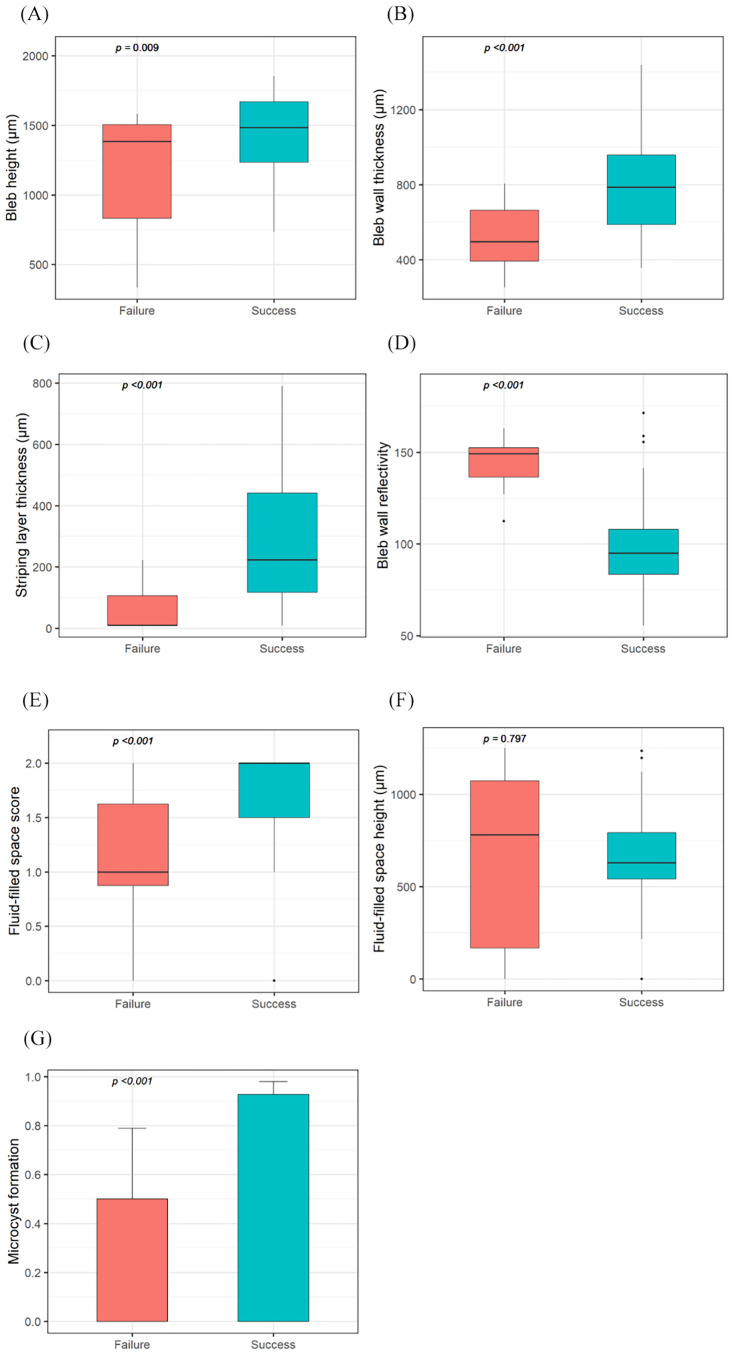
Fig 4. Boxplot of the intrableb parameters assessed with anterior segment optical coherence tomography after trabeculectomy with amniotic membrane transplantation for the comparison of the success and failure groups.
(A) Bleb was higher in the success group than that in the failure group. (B) Bleb wall was thicker in the success group than that in the failure group. (C) Stripping layer was thicker in the success groups than that in the failure group. (D) Bleb wall reflectivity was lower in the success group than that in the failure group. (E) Fluid-filled space score was greater than that in the failure group. (F) There was no significant difference in the fluid-filled space height between the two groups. (G) Microcyst formation was more frequently noted in the success group than in the failure group.

