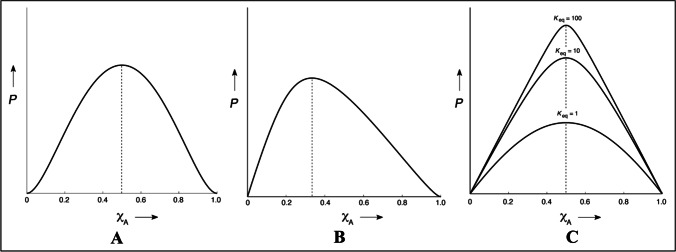
Fig. 7.
Different curves of Job’s Plot, where P – Measured physical or analytical property, XA – Mole fraction of Drug. While figure A – represents the stoichiometry of complexation in 1:1 (Maximum of curve at XA is 0.5), figure B – represents the stoichiometry of complexation in 1:2 (Maximum of curve at XA is 0.33) and figure C – represents the various shapes of job’s plot in 1:1 stoichiometric complexation indicating equilibrium constant (km:n)
Reproduced with permission from ref [159].

