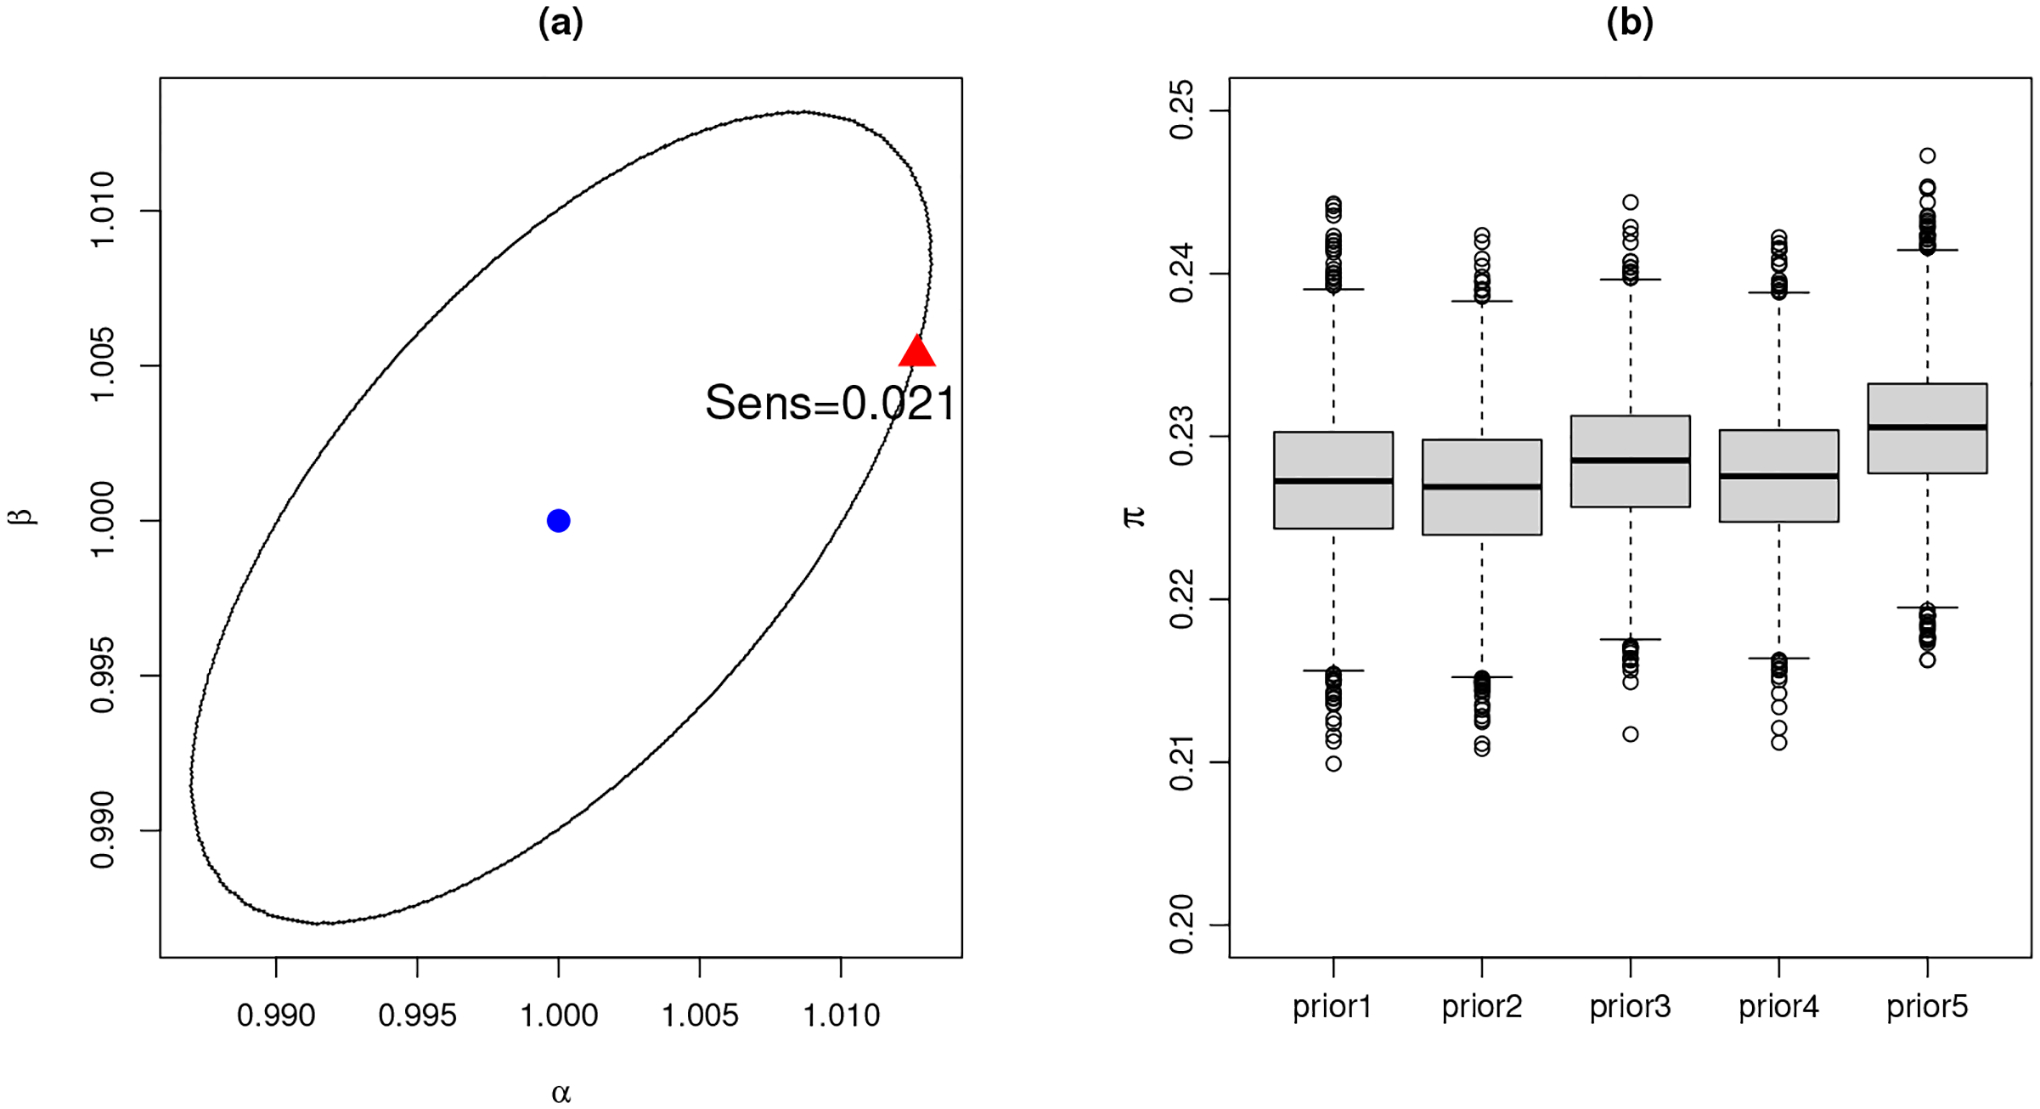
Fig 7.

Sensitivity analysis for π: (a). The ϵ-local circular sensitivity. The ellipse is the contour line around the centroid (blue dot) at (α, β) = (1, 1) with Hellinger distance ϵ = 0.00354. The worst-case sensitivity is obtained at the red triangle with sensitivity value 0.021. (b). An ad hoc sensitivity analysis with modified prior hyperparameters. The box plots show posterior samples of π with respect to each prior modification.
