FIGURE 1.

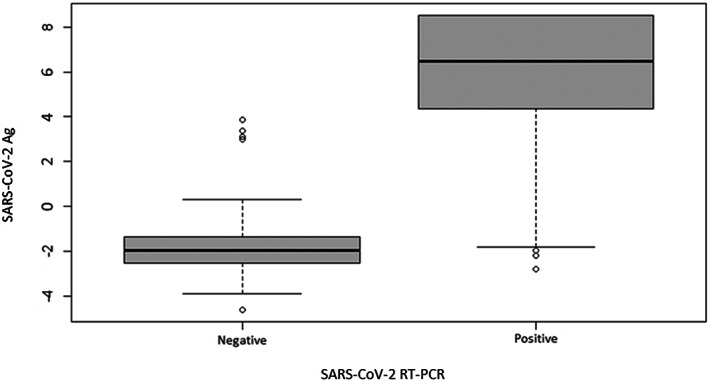
Comparison of the results between the SARS‐CoV‐2 antigen (Ag) test and RT‐PCR. Box plot shows that mean antigen concentration among the PCR‐positive samples was significantly higher than among PCR‐negative samples (p < 0.00001, W = 720.5).

Comparison of the results between the SARS‐CoV‐2 antigen (Ag) test and RT‐PCR. Box plot shows that mean antigen concentration among the PCR‐positive samples was significantly higher than among PCR‐negative samples (p < 0.00001, W = 720.5).