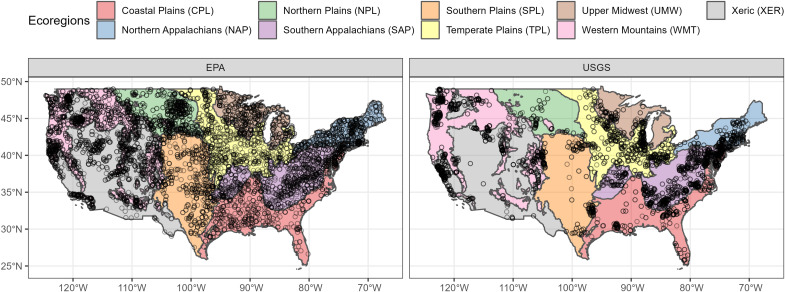
Fig. 1. The spatial distribution of sites within ecoregions that were used to calculate site-level biodiversity metrics (total densities and α diversity) and regional biodiversity metrics (, γest, and β diversities).
We used a newly derived dataset that combines 27 years of standardized stream macroinvertebrate monitoring conducted by the EPA and USGS. For an additional detailed map, see fig. S1.

