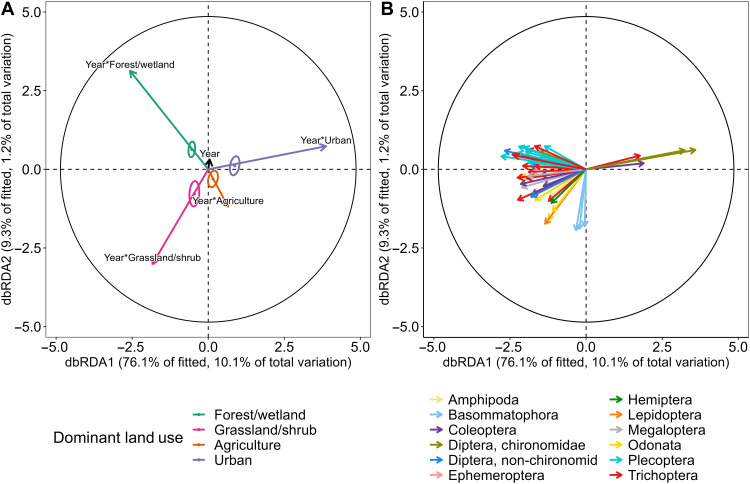
Fig. 4. Partial distance-based redundancy analysis (accounting for agency, ecoregion, and improvements in taxonomic identification) demonstrating that composition of macroinvertebrate communities has changed differentially through time according to land use.
(A) Plot of model predictors showing the additive and interactive effects of land use and year. Individual points and circles are the centroids and 95% confidence intervals of ecoregion-year combinations according to dominant land use. (B) Corresponding vector overlay of model responses. Individual vectors are either families for all non-chironomid macroinvertebrates or subfamilies for chironomids. As shown in the legend, non-chironomid macroinvertebrate vectors are colored by order, and chironomid vectors are colored by family. Vectors with lengths less than 0.3 have been excluded. In both plots, the black circles correspond to vector lengths that would have a correlation coefficient of one with each axis. The entire dbRDA model explains 44.6% of the variance. Additional statistical output included in table S6.

