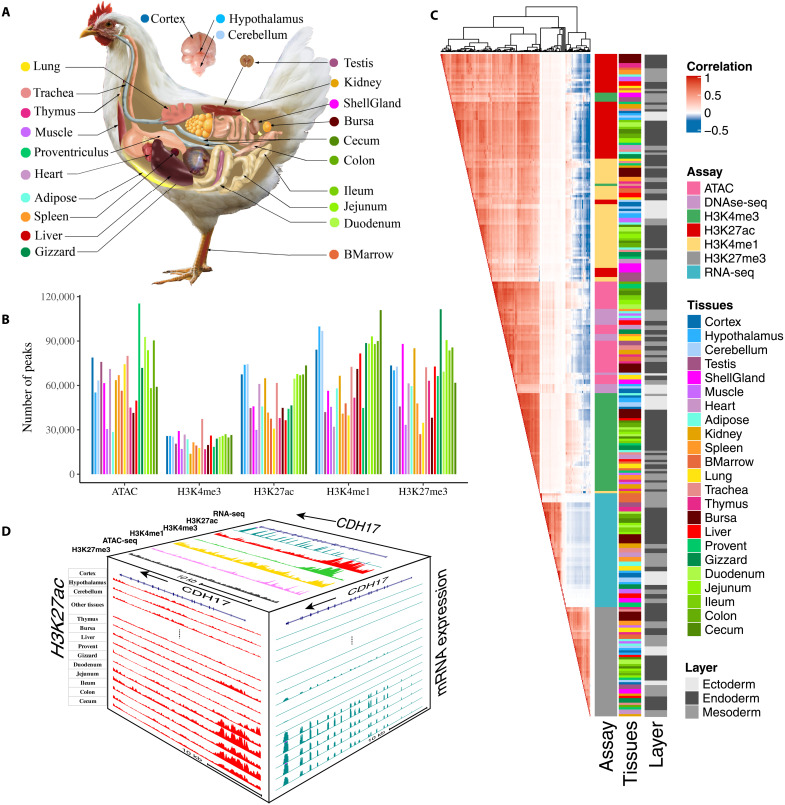
Fig. 1. The summary of chicken epigenomic atlas.
(A) The 23 tissues that were profiled for building the epigenomic atlas in chickens. BMarrow, bone marrow; ShellGland: shell gland; Cortex: corticoidea dorsolateralis. (B) The average number of peaks detected for each of five epigenetic marks across tissues. (C) The relationship among assay, tissue, germ layers based on Pearson’s correlations of normalized signal in 1-kb windows stepped across the whole genome. (D) The distribution of assay signals around CDH17 gene across tissues (chr2:125,878,923-125,908,898, galGal6). Top face is jejunum. The vertical scale of UCSC tracks shows the normalized signal from 0 to 500 for RNA-seq, 0 to 150 for H3K27ac and H3K4me3, and 0 to 100 for other marks and ATAC-seq.

